DBpedia-Spotlight-Dashboard - GSoC 2021
Table of Contents
- Objective
- Raw data
- Dashboard chart
- Dashboard content
- Evaluation
- Used tools
- How to run
- Conclusions
- Future work
- Progress
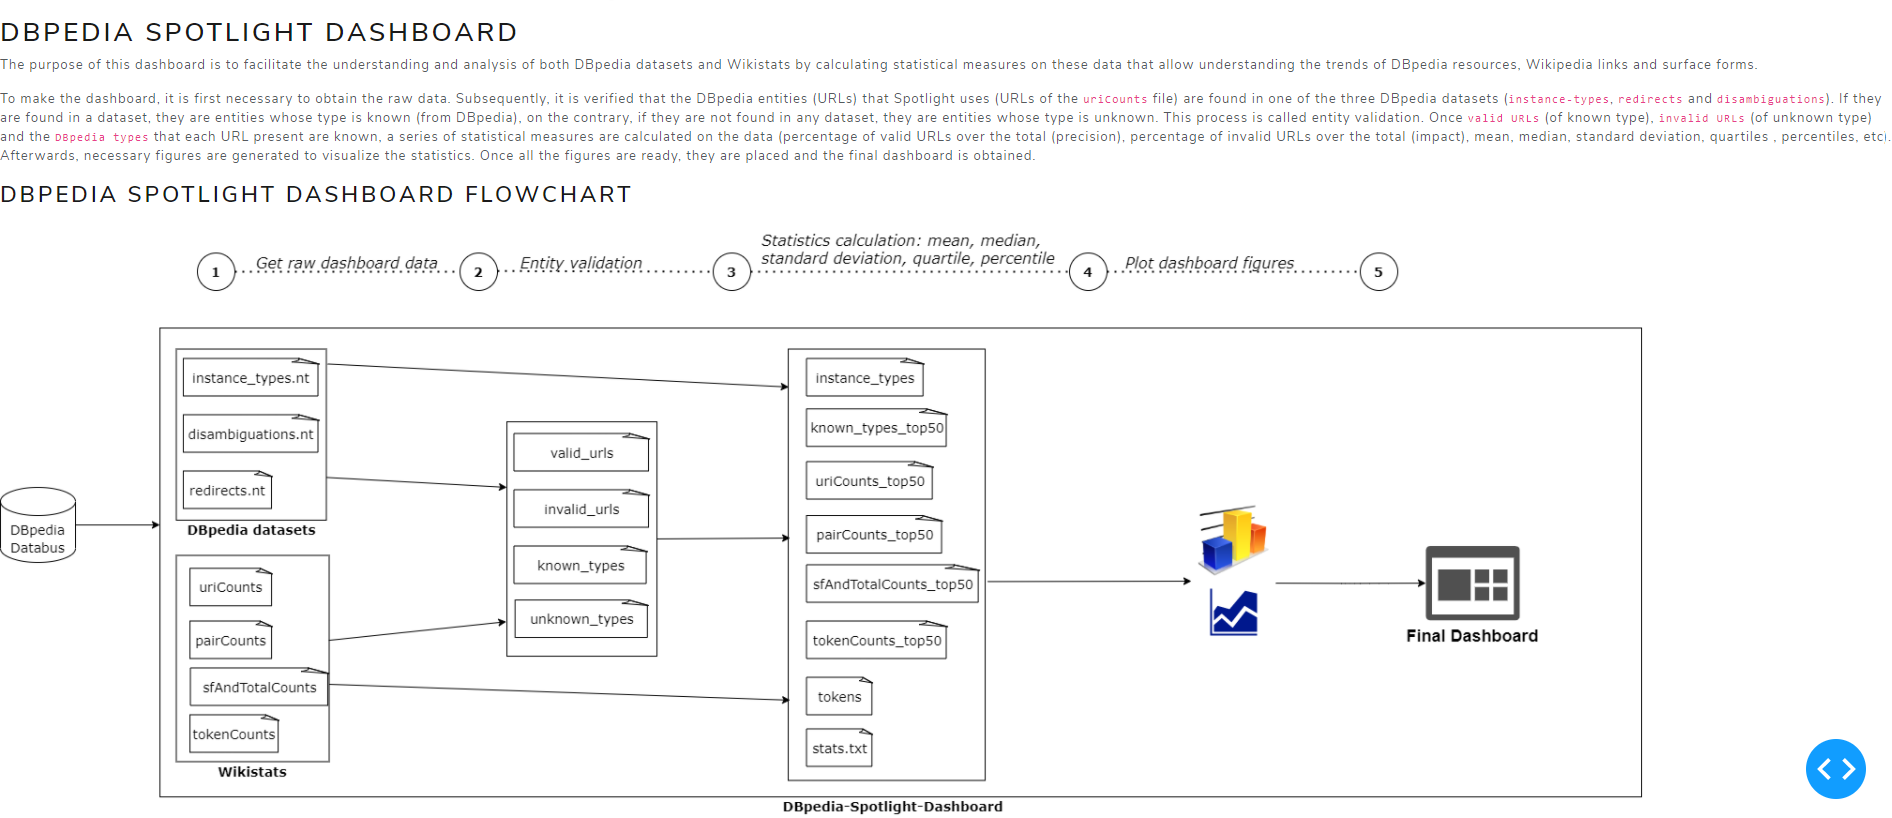
Objective
The purpose of this dashboard is to facilitate the understanding and analysis of both DBpedia datasets (instance-types, redirects and disambiguations) and Wikipedia’s statistics (uriCounts, pairCounts, sfAndTotalCounts and tokenCounts) by calculating statistical measures on these data that allow understanding the trends of DBpedia resources, Wikipedia links and surface forms.
To make the dashboard, these steps have been followed:
- Obtain raw data from the DBpedia Databus
- Entity validation process: throughout the project, it was seen that there are Spotlight entities whose type is unknown. This process consists of determining the DBpedia entities with
known typesand those withunknown types. DBpedia entities with known types will be found in one of the following datasets:instance-types,redirects, anddisambiguations. Whereas entities with unknown types will not be found in any of them. - Computation of statistical measures: percentage of entities with known types over the total (precision), percentage of entities with unknown types over the total (impact), mean, median, standard deviation, quartiles, percentiles…
- Plot dashboard figures
Raw Data
As mentioned before, the statistical measures have been calculated from the DBpedia datasets and the Wikipedia statistical files (Wikistats)
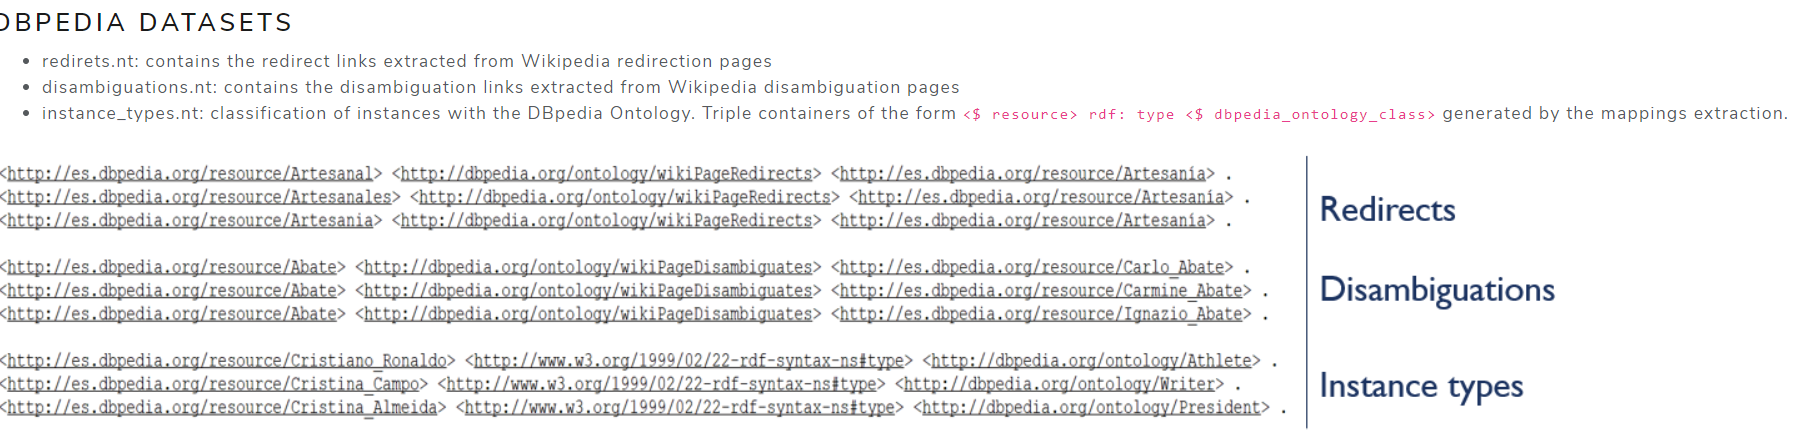
DBpedia Datasets
- redirects.nt: contains the redirect links extracted from Wikipedia redirection pages
- disambiguations.nt: contains the disambiguation links extracted from Wikipedia disambiguation pages
- instance_types.nt: classification of instances with the DBpedia Ontology. Triple containers of the form
<$ resource> rdf: type <$ dbpedia_ontology_class>generated by the mappings extraction.
| DBpedia Dataset | Sample |
|---|---|
| redirects.nt | <http://es.dbpedia.org/resource/Artesanal> <http://dbpedia.org/ontology/wikiPageRedirects> <http://es.dbpedia.org/resource/Artesanía> . |
| disambiguations.nt | <http://es.dbpedia.org/resource/Abate> <http://dbpedia.org/ontology/wikiPageDisambiguates> <http://es.dbpedia.org/resource/Carlo_Abate> . |
| instance_types.nt | <http://es.dbpedia.org/resource/Cristiano_Ronaldo> <http://www.w3.org/1999/02/22-rdf-syntax-ns#type> <http://dbpedia.org/ontology/Athlete> . |
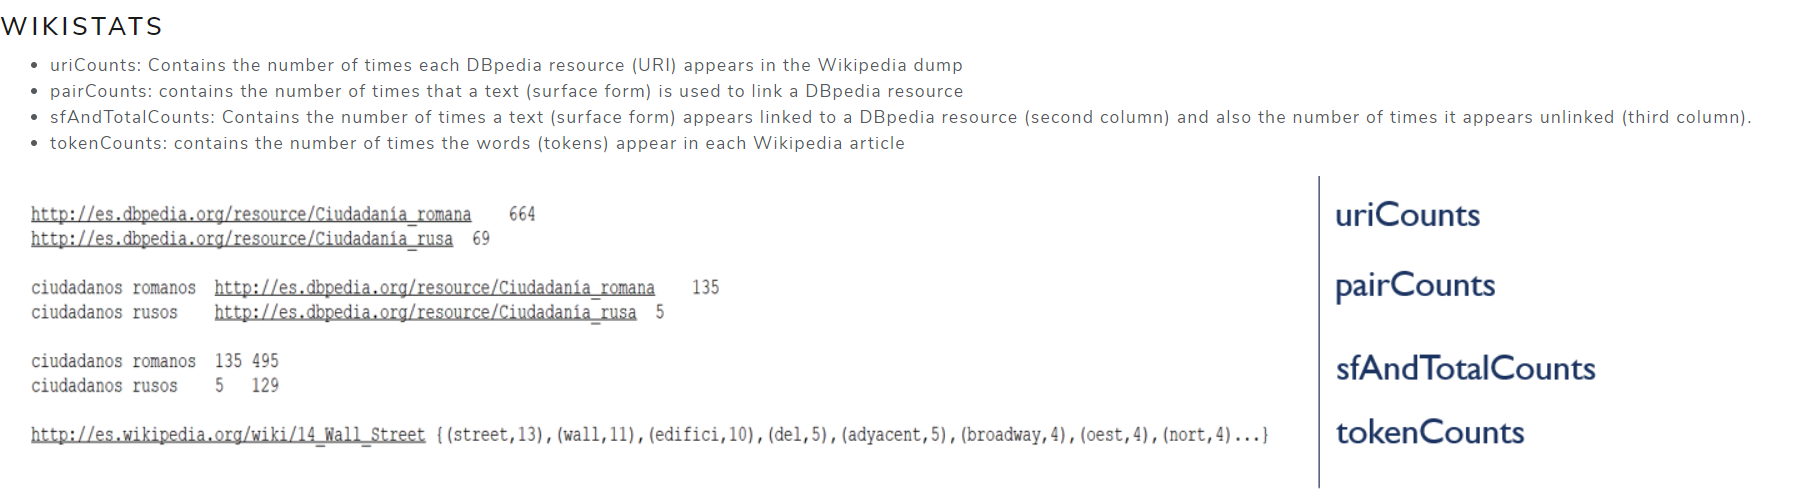
Wikistats
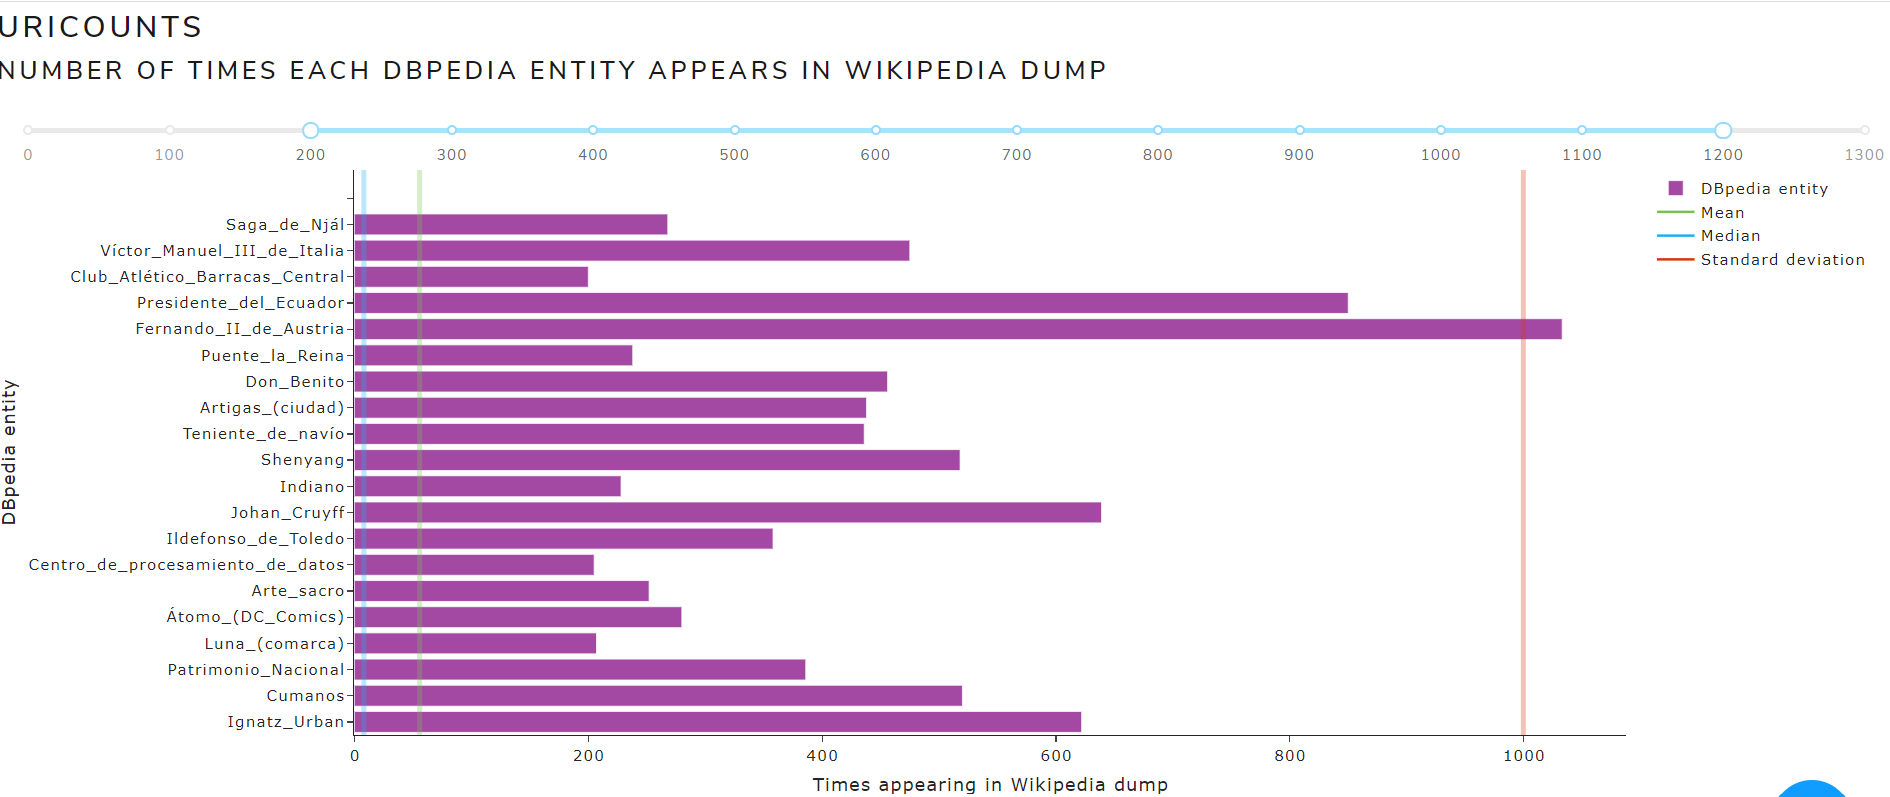
- uriCounts: Contains the number of times each DBpedia resource (URI) appears in the Wikipedia dump
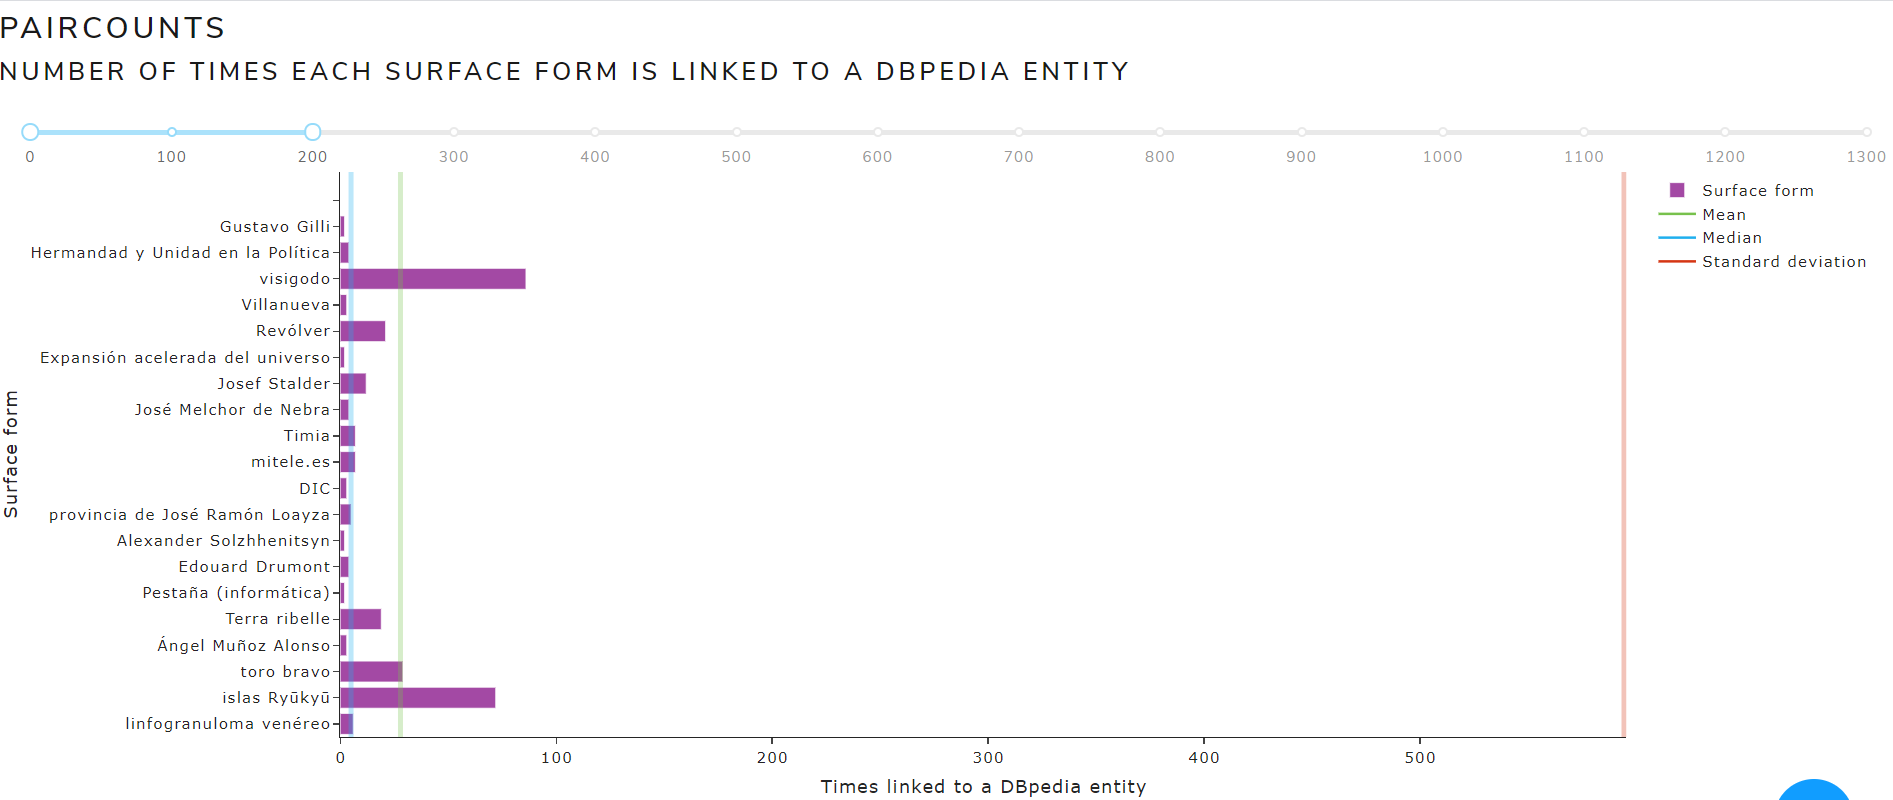
- pairCounts: contains the number of times that a text (surface form) is used to link a DBpedia resource
- sfAndTotalCounts: Contains the number of times a text (surface form) appears linked to a DBpedia resource (second column) and also the number of times it appears unlinked (third column).
- tokenCounts: contains the number of times the words (tokens) appear in each Wikipedia article
| File | Sample |
|---|---|
| uriCounts | http://es.dbpedia.org/resource/Ciudadanía_rusa 69 |
| pairCounts | ciudadanos rusos http://es.dbpedia.org/resource/Ciudadanía_rusa 5 |
| sfAndTotalCounts | ciudadanos rusos 5 133 |
| tokenCounts | http://es.wikipedia.org/wiki/14_Wall_Street {(street,13),(wall,11),(edifici,10),(del,5),(adyacent,5),(broadway,4)...} |
DBpedia Spotlight Dashboard Flowchart
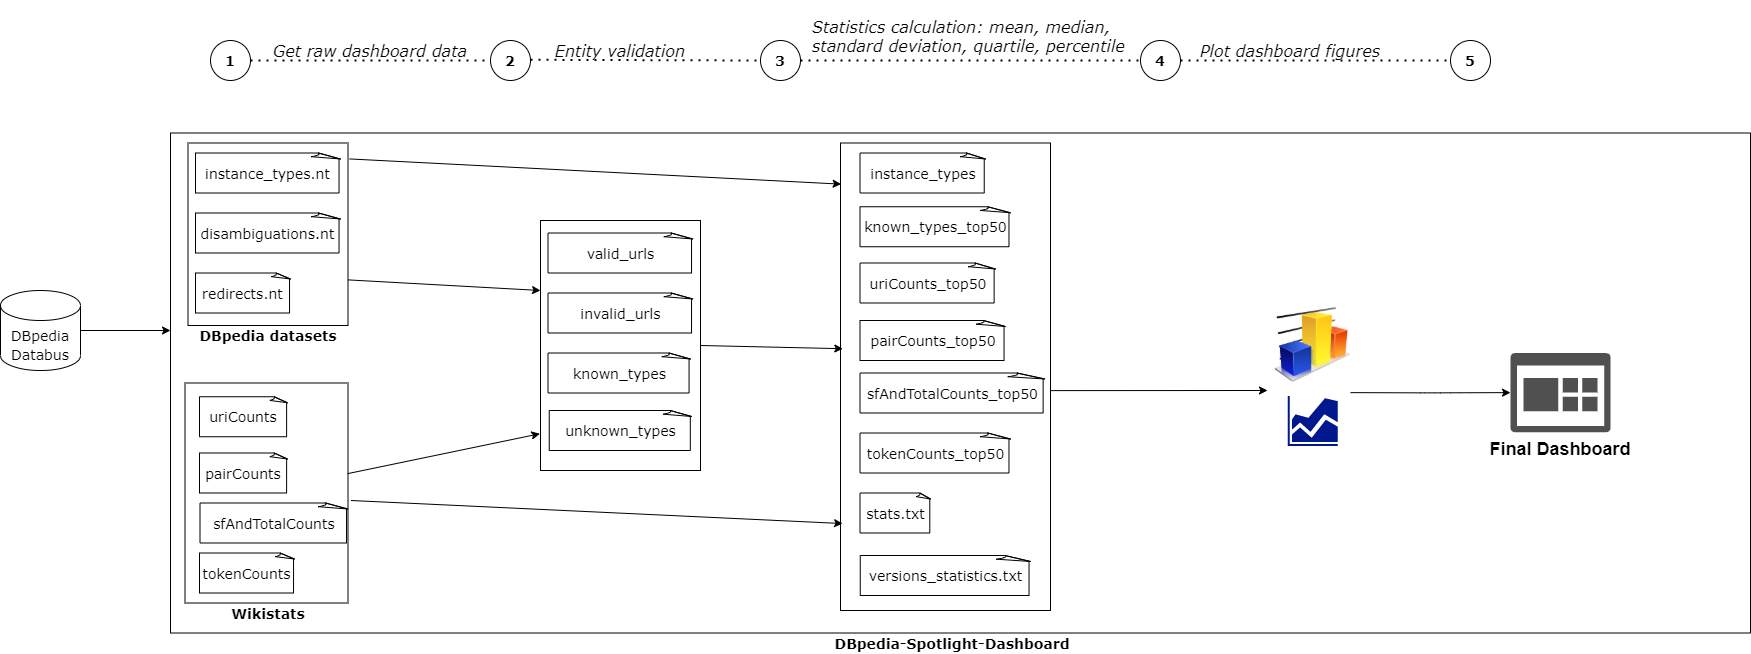 Figure 1. DBpedia Spotlight Dashboard Flowchart
Dashboard Content
The dashboard consists of 4 tabs:
Figure 2 shows the 4 main tabs of the dashboard
 Figure 2. Dashboard tabs
Information tab
This tab explains:
- The purpose of this dashboard
- How the statistics have been computed
- The entity validation process
- The raw files that DBpedia Spotlight uses during the generation of a language model
Instance-types comparison tab
This tab is used to compare the instance-types of the versions October 2016, October 2020, May 2021 and June 2021 for English and Spanish languages
It is divided into 3 views:
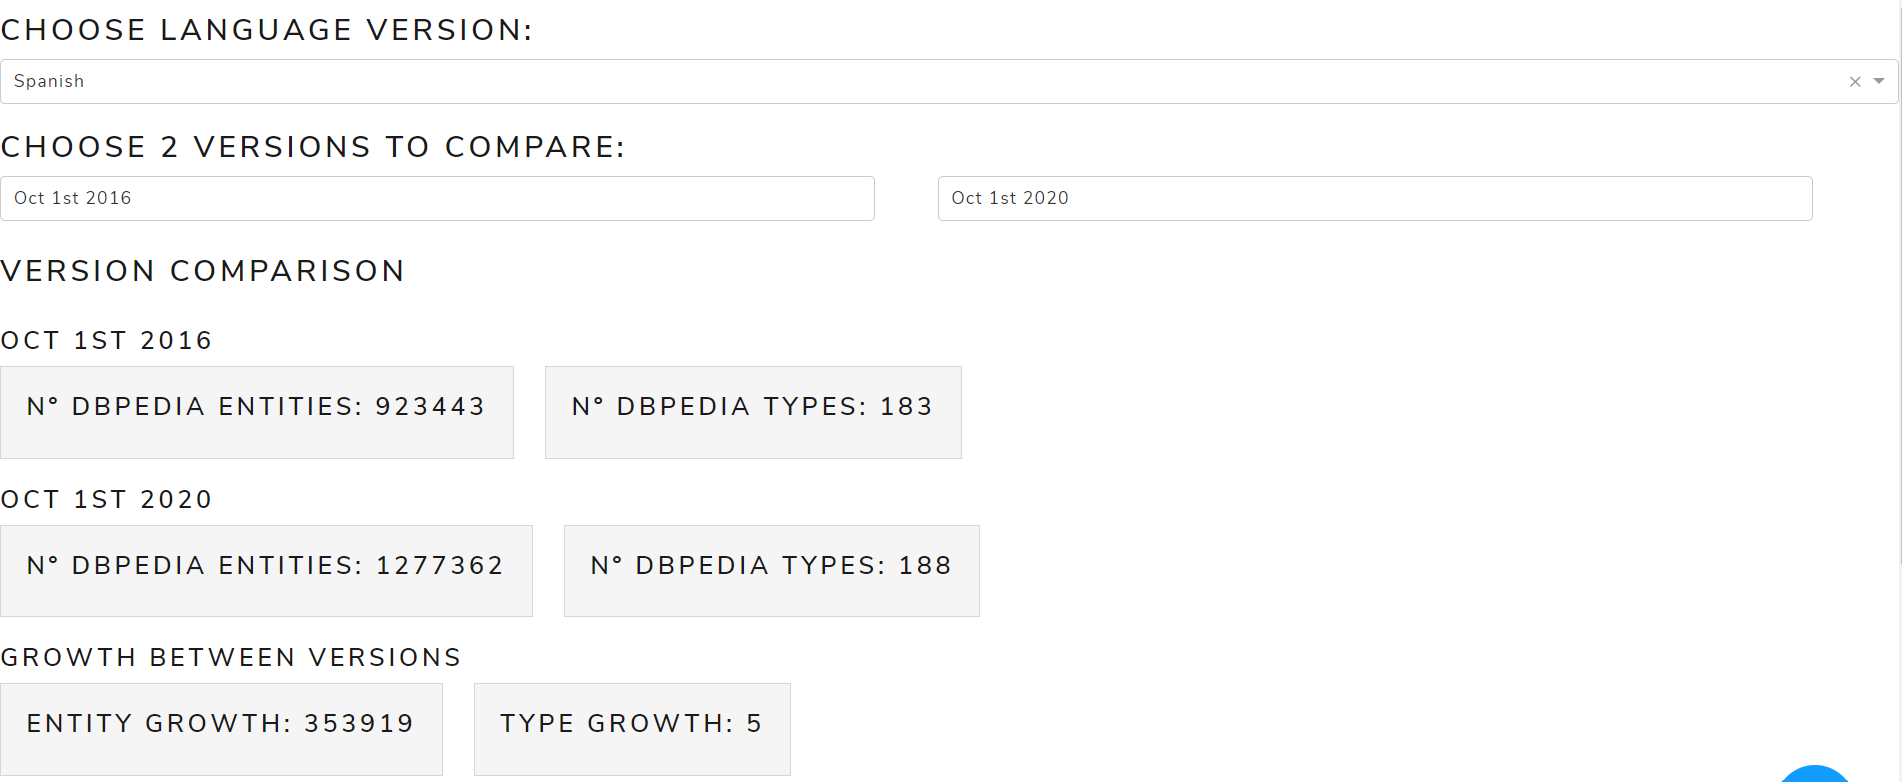
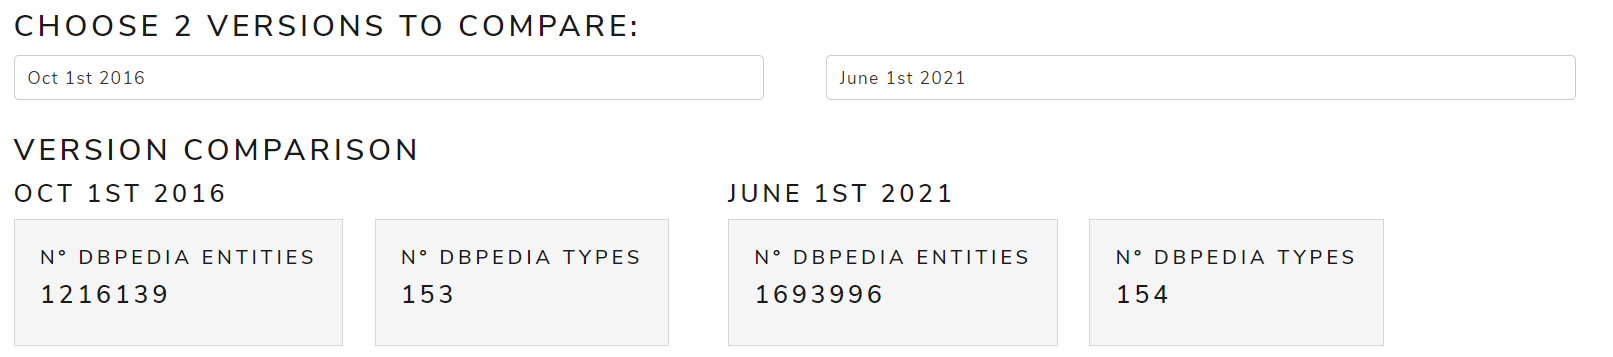
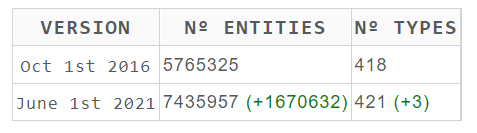
- Version comparison: a table to compare the number of entities and types of the selected versions as well as their differences
Figure 3 shows a table with entities and types of October 2016 and May 2021 versions for the English language.
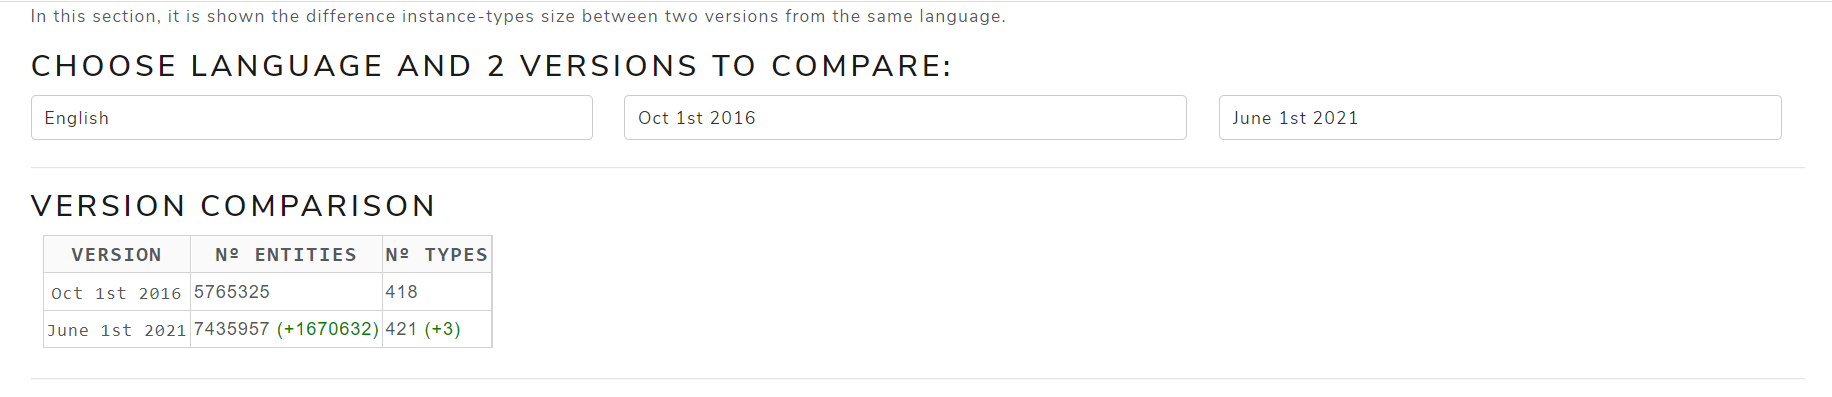 Figure 3. Version comparison
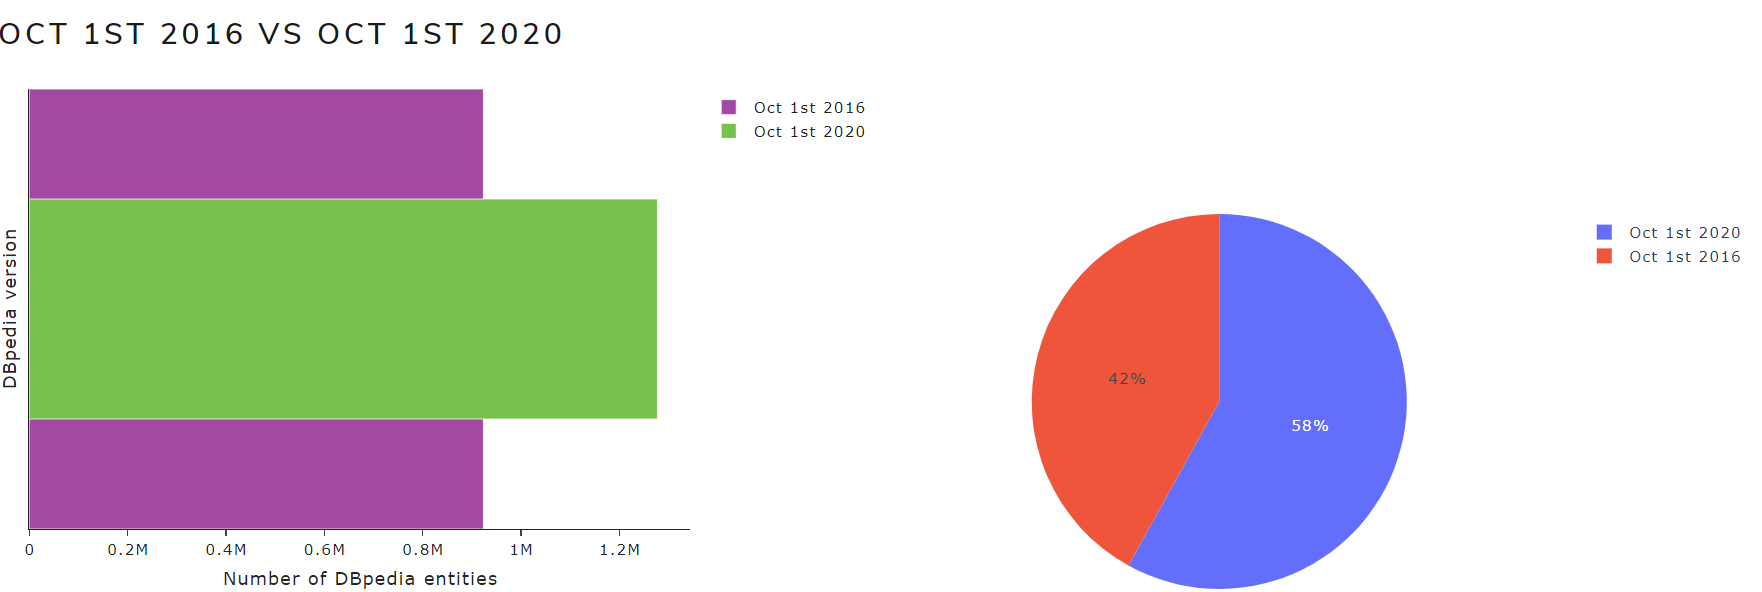
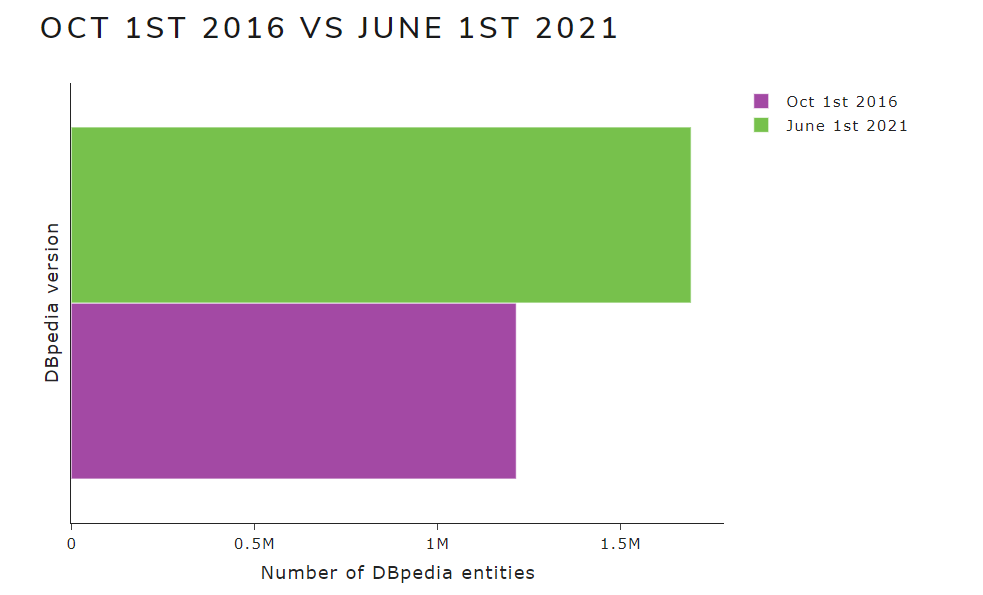
- Version 1 VS Version 2: a chart illustrates the number of entities from the selected versions
Figure 4 shows a chart with the number of entities of October 2016 and May 2021 versions for the English language.
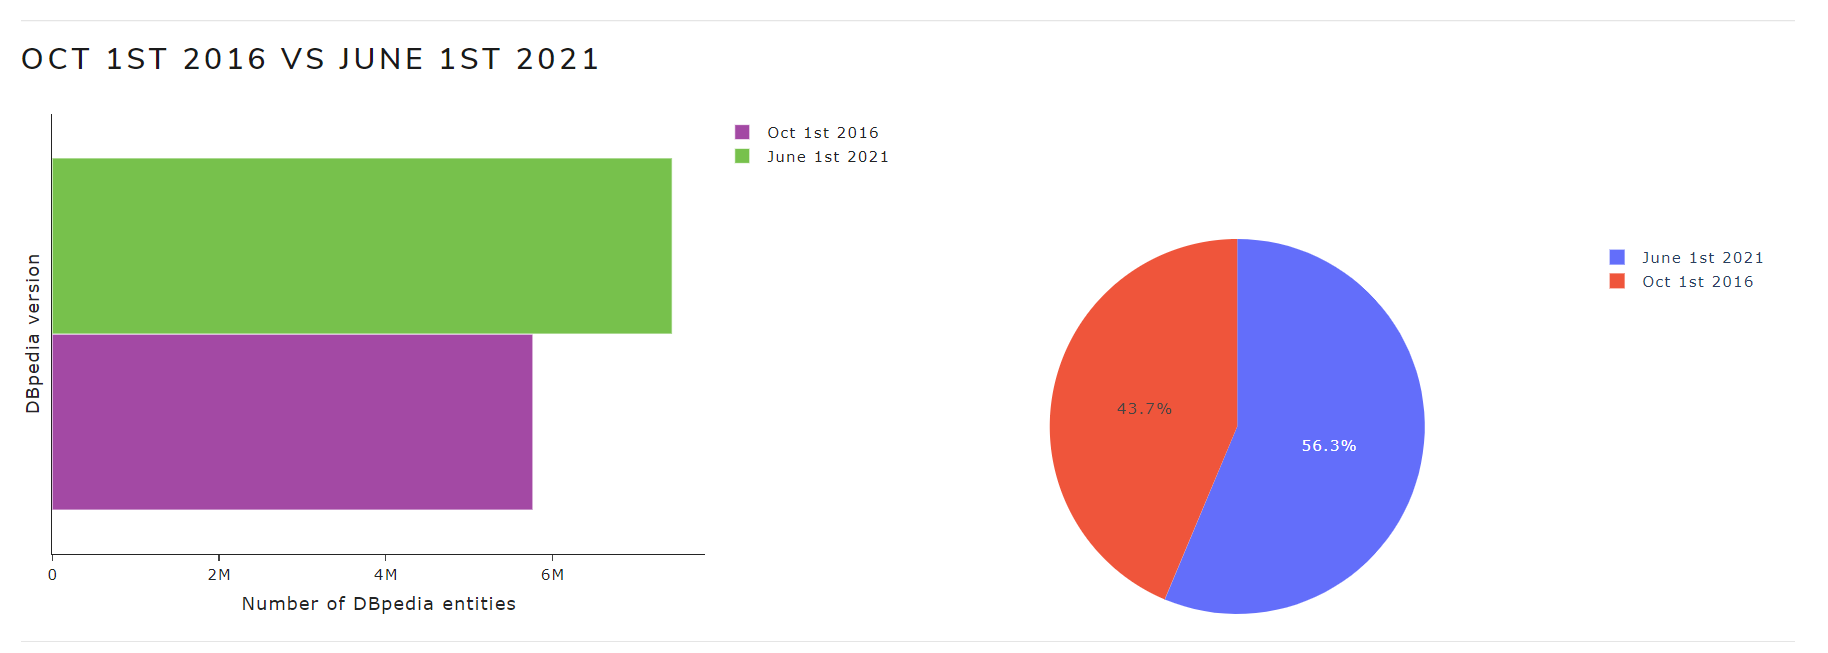 Figure 4. Version 1 VS Version 2
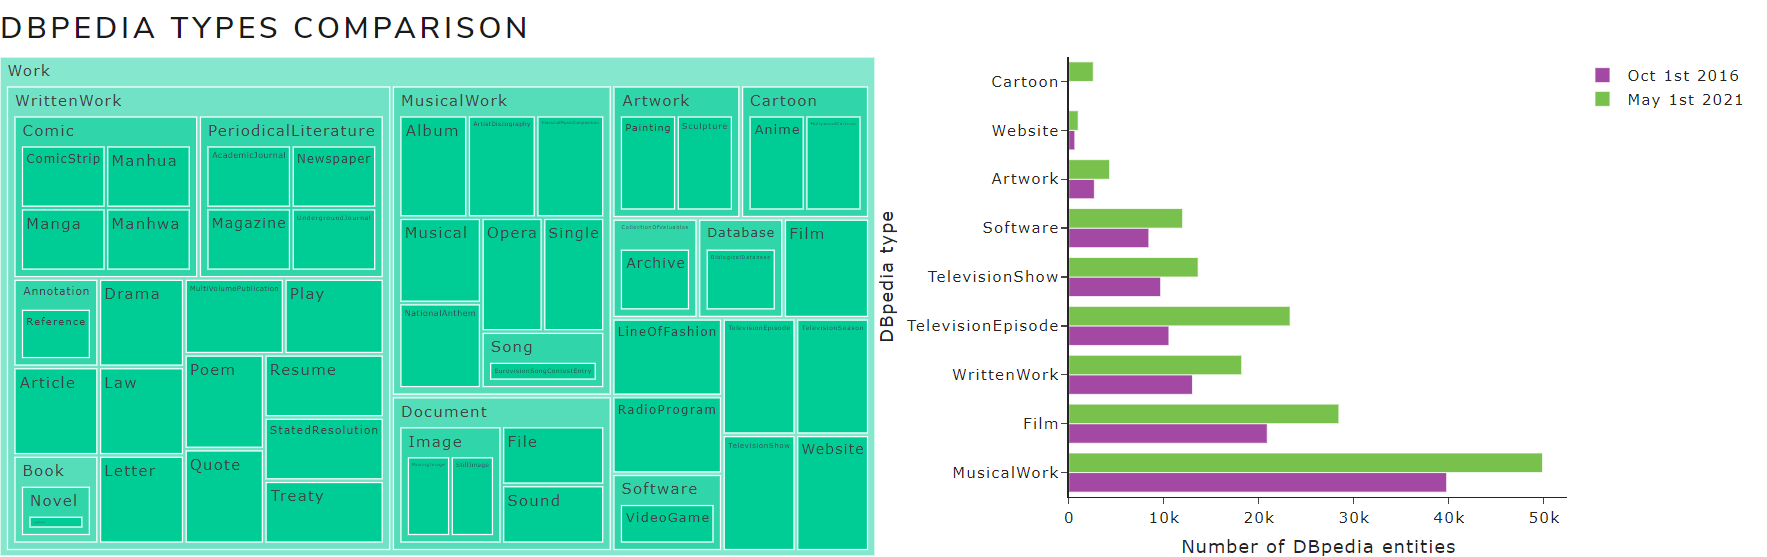
- DBpedia types comparison: the entities from each selected version are graphically compared based on the DBpedia hierarchy of classes
Figure 5** shows a chart with the number of entities by DBpedia types of October 2016 and May 2021 versions for the English language.
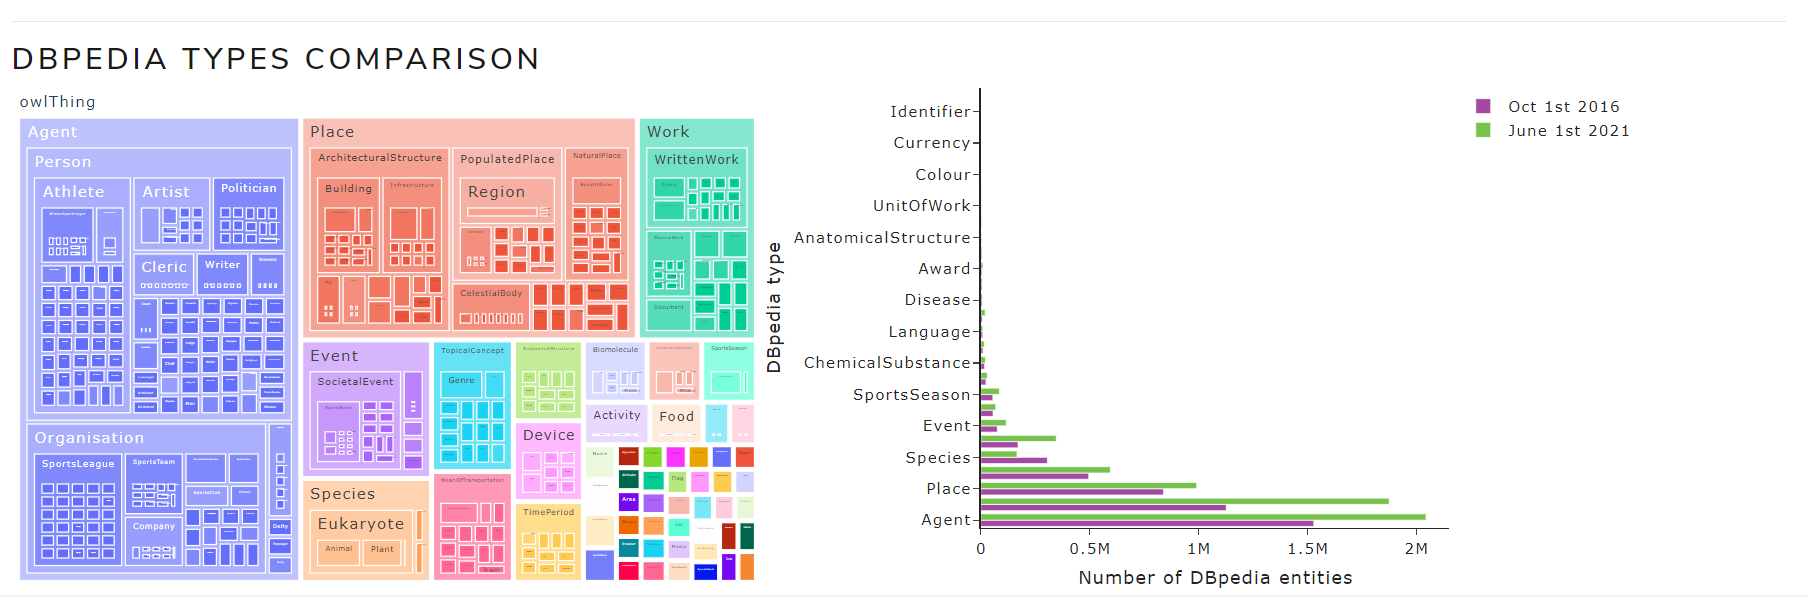 Figure 5. DBpedia types comparison
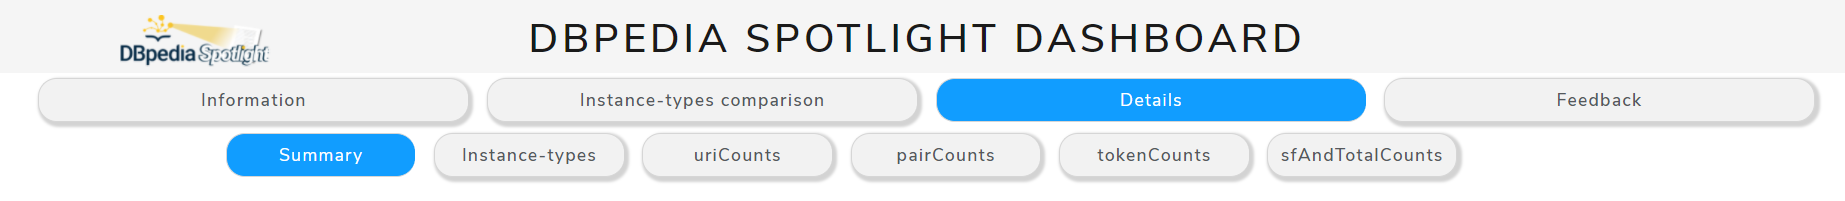
Details tab
It contains 6 sub-tabs:
- Summary
- Instance-types
- uriCounts
- pairCounts
- tokenCounts
- sfAndTotalCounts
Figure 6 shows the 6 sub-tabs of the Details tab
 Figure 6. Sub-tabs of Details tab
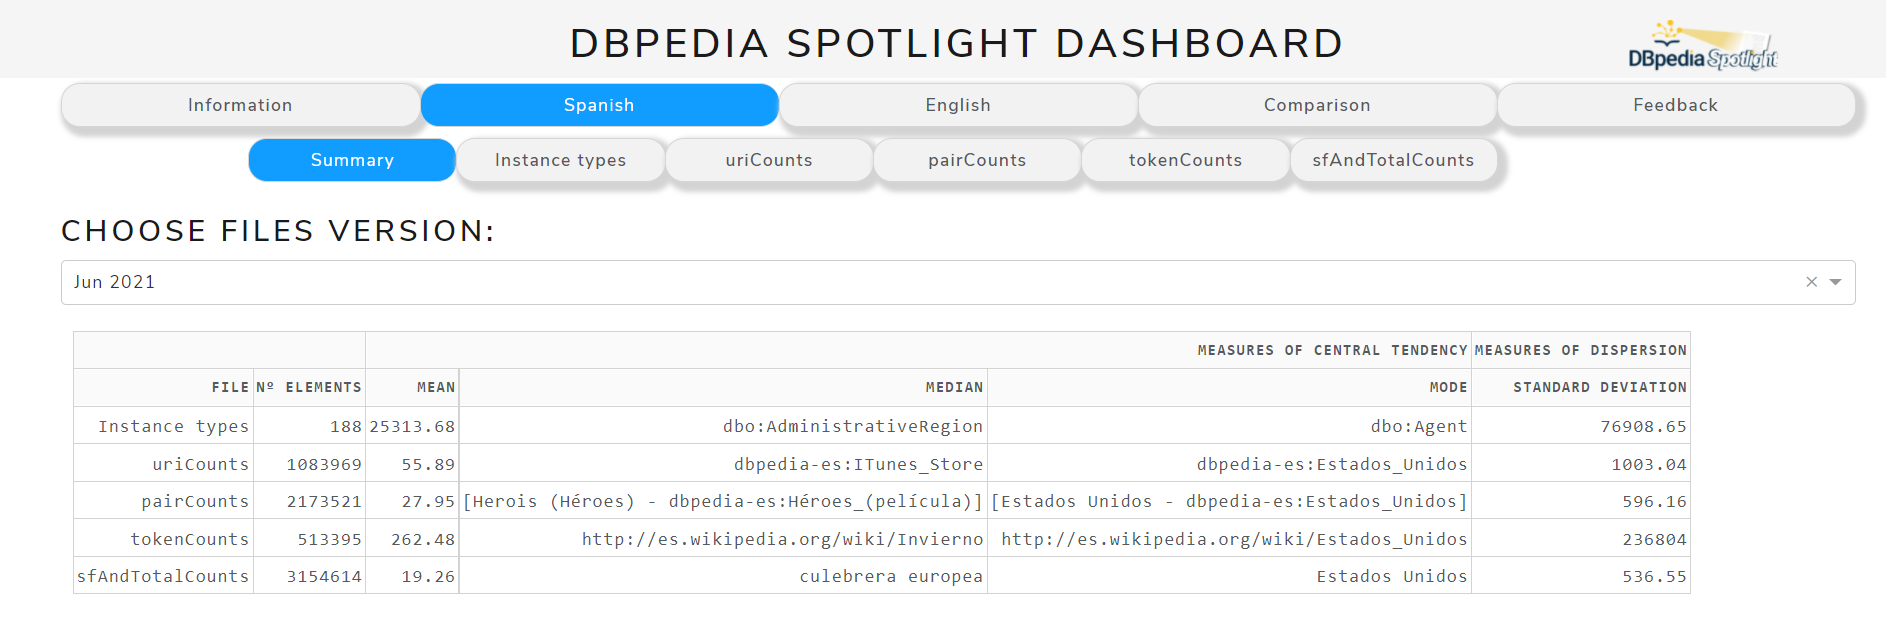
Summary
It shows the calculated statistics.
In Figure 7 can be seen measures of central tendency (mean and mode) that are used to know where the data is inclined or clustered the most. In this case, we can see how the DBpedia entities, surface forms and Wikipedia tokens are grouped. Also it can be seen the standard deviation, which is the main measure of dispersion, that is used to observe the degree of variability of DBpedia entities, surface forms and Wikipedia tokens.
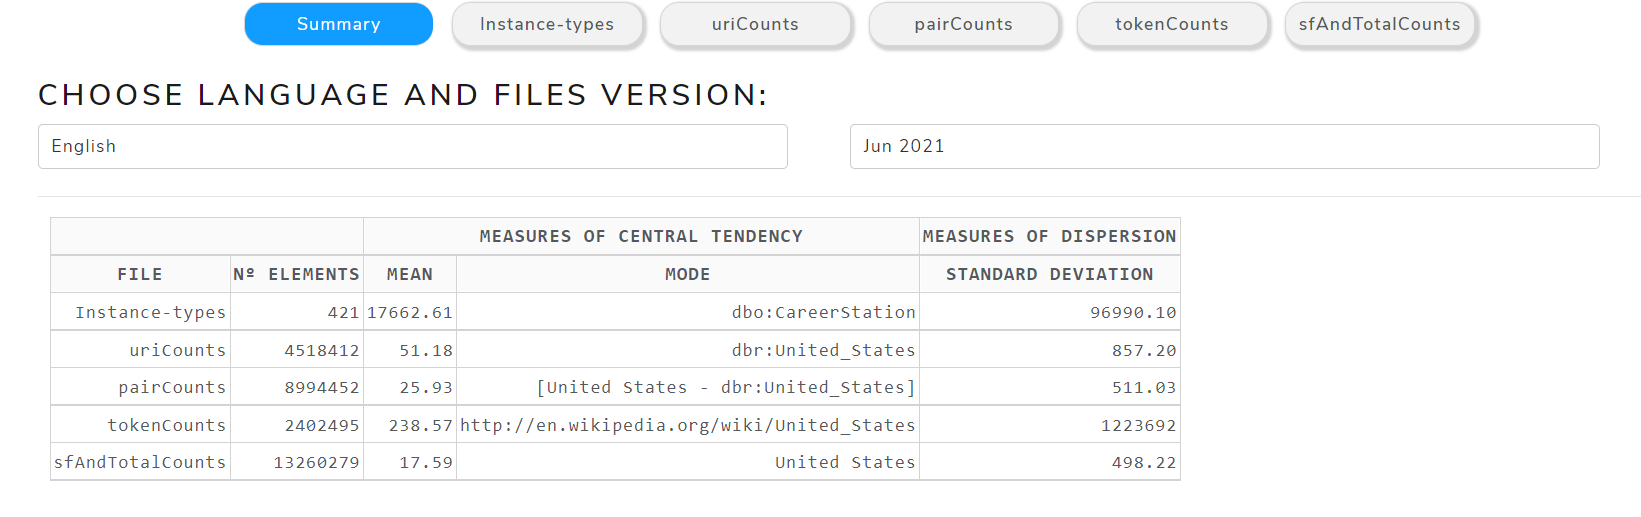 Figure 7. Table with statistical measures of Jun 2021 version for English language
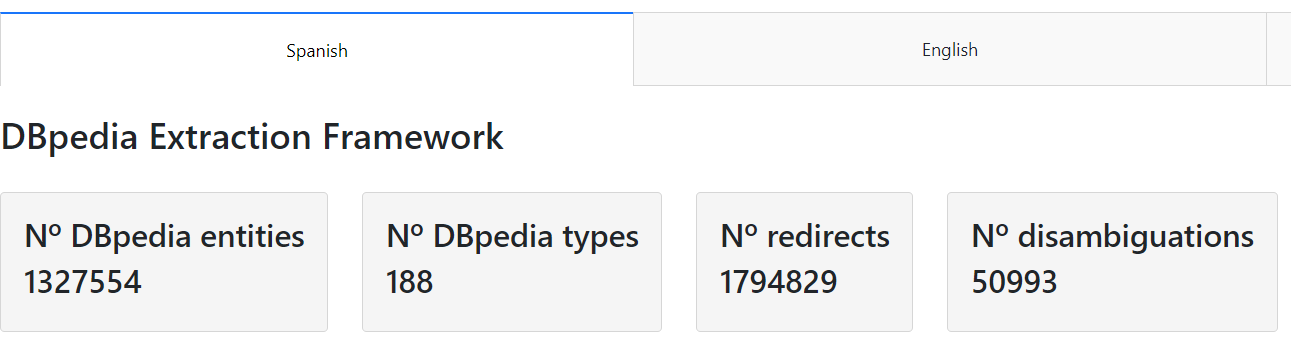
Instance-types
Allows to view the instance-types in more detail for the selected language and version
Figure 8 shows part of the content of the instance-types sub-tab of May 2021 version for the English language .
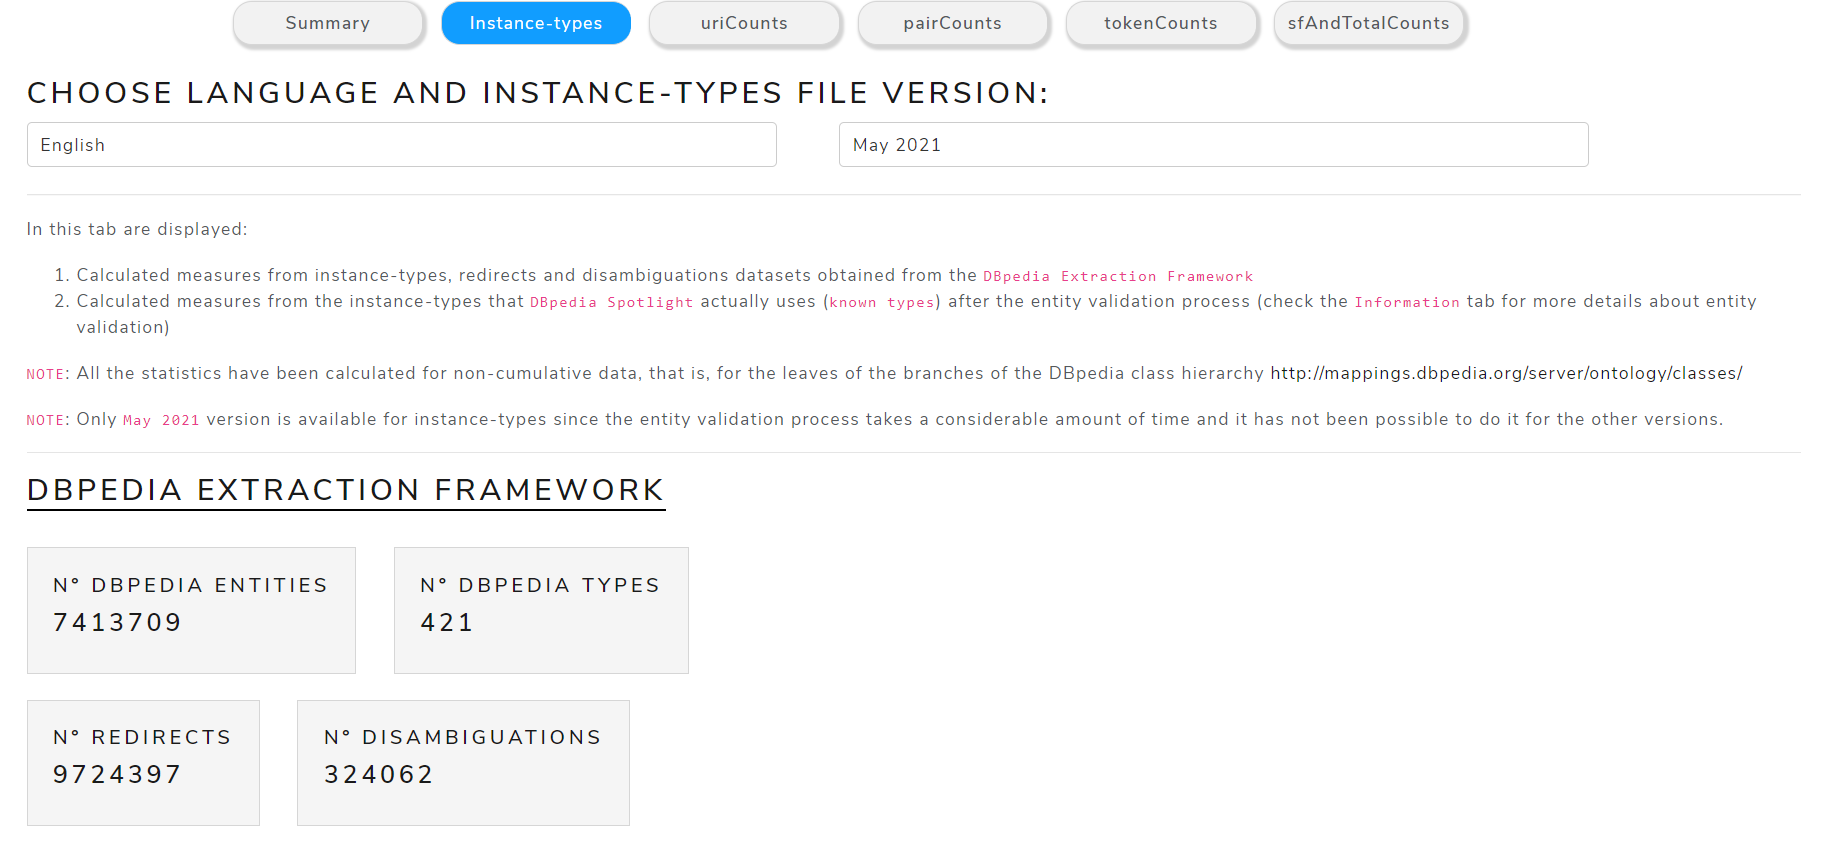 Figure 8. Instance-types details
It is divided in two main sections:
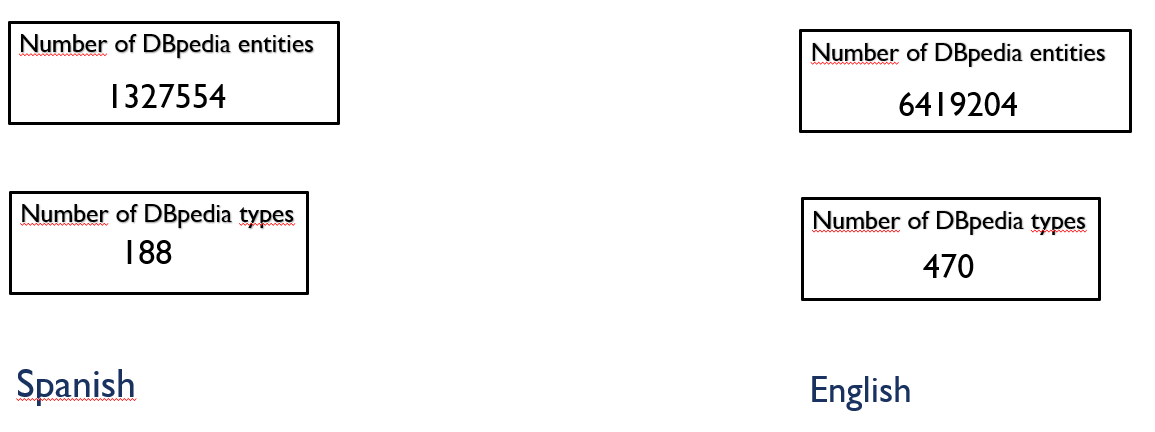
- DBpedia Extraction Framework: to see metrics about the
raw filesof the DBpedia Databus that Spotlight uses to generate the models - DBpedia Spotlight: to see metrics about the entities and types that are actually used by DBpedia Spotlight after the
entity validation process
Both sections are formed by the following views:
- Measures of Central Tendency: mean, mode
-
Measures of Dispersion: standard deviation
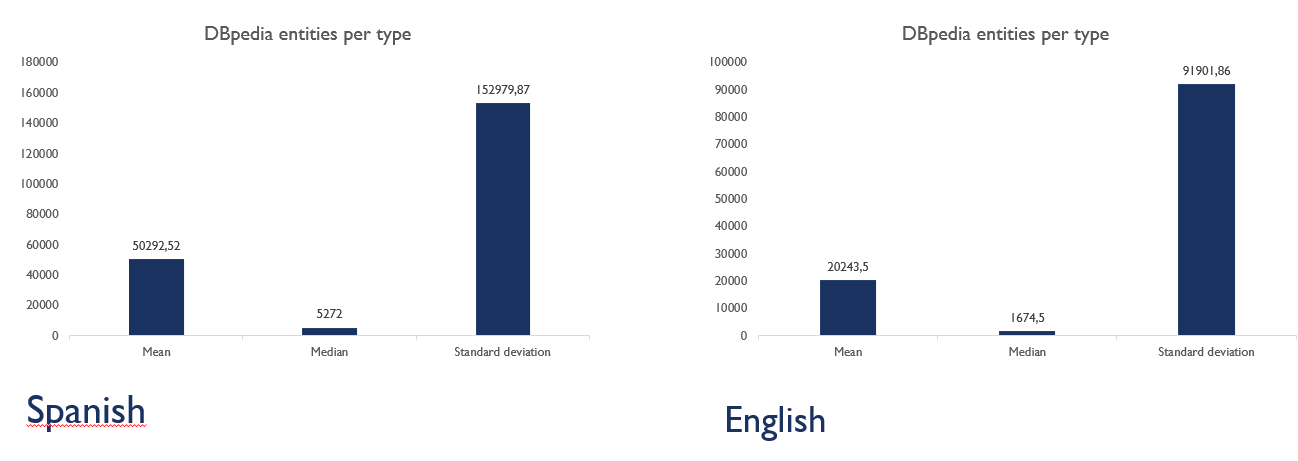
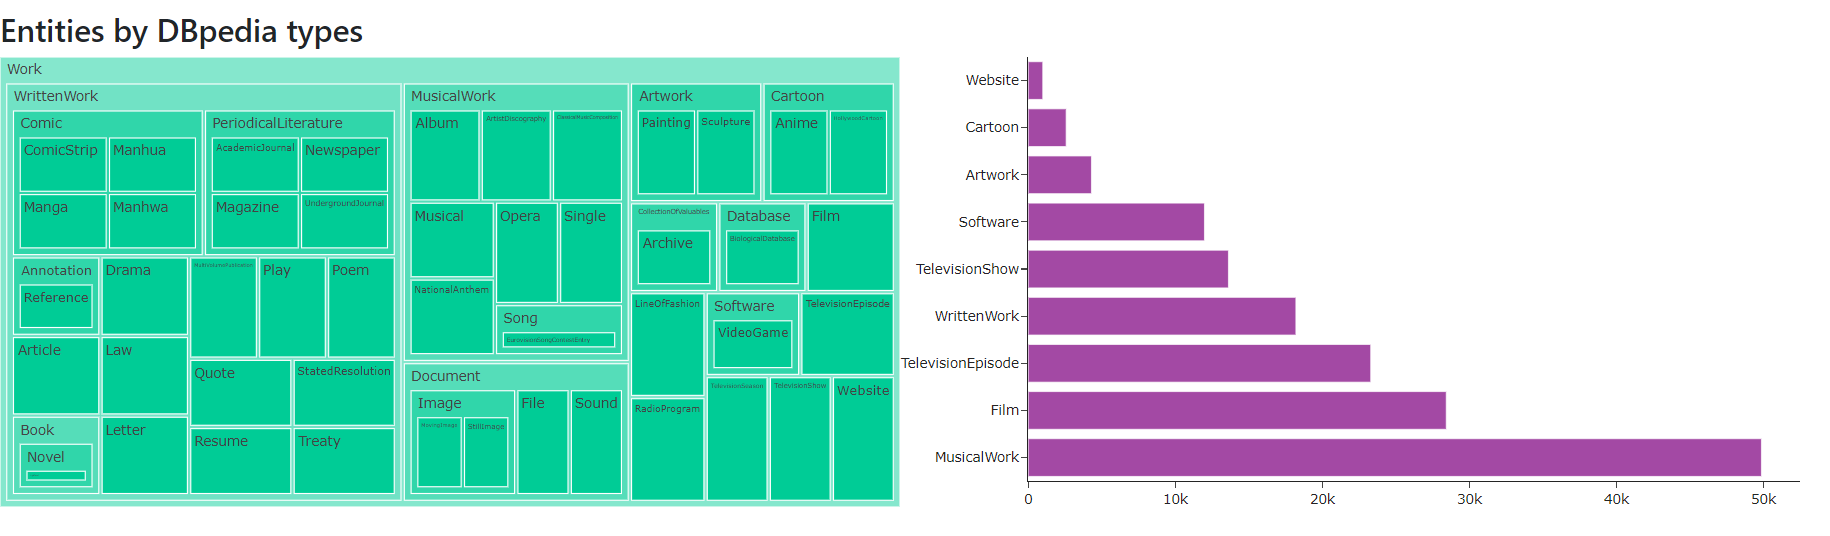
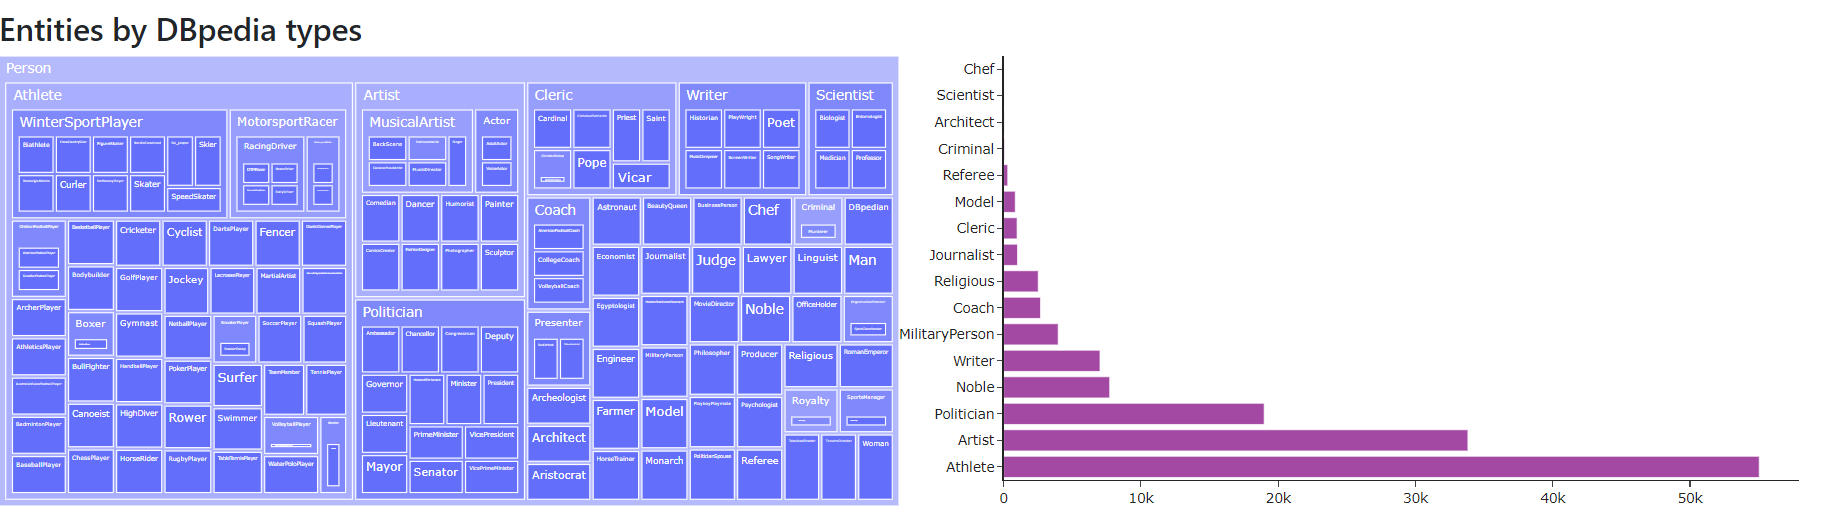
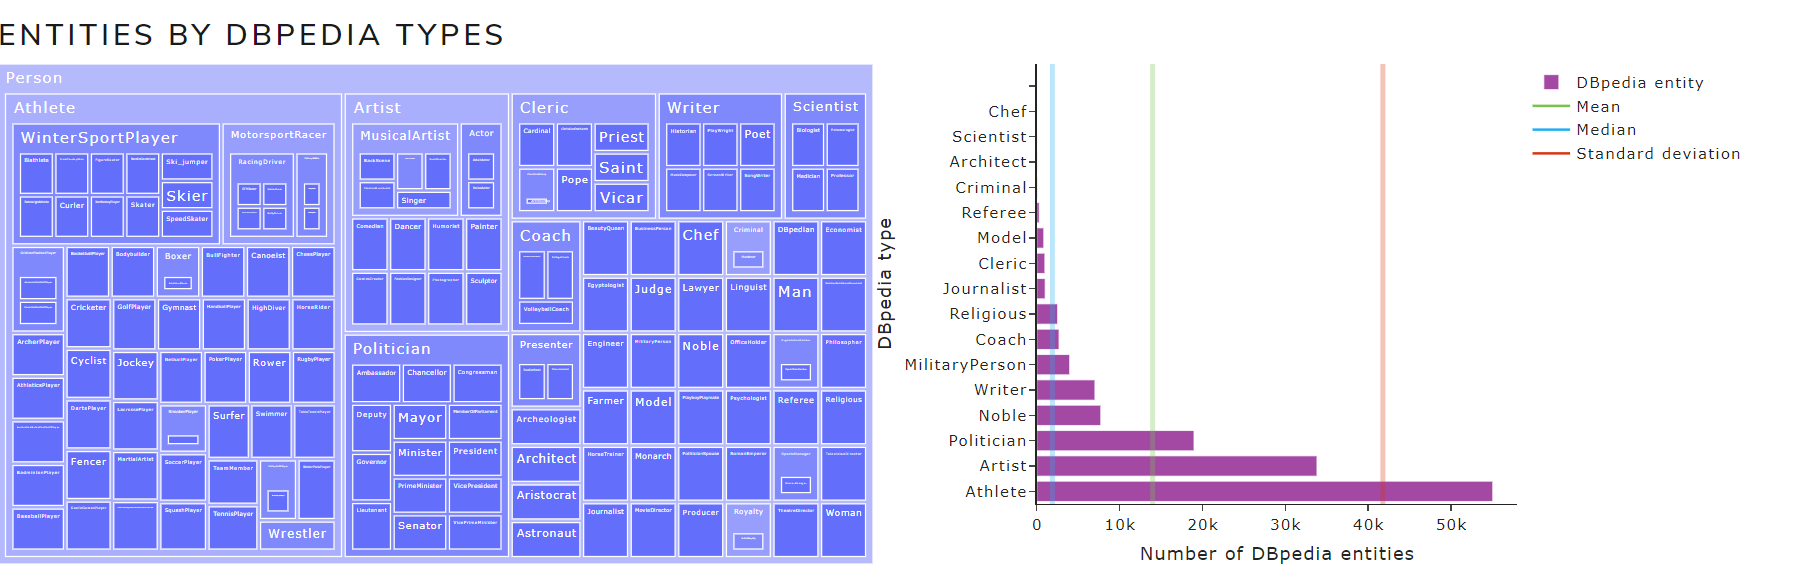
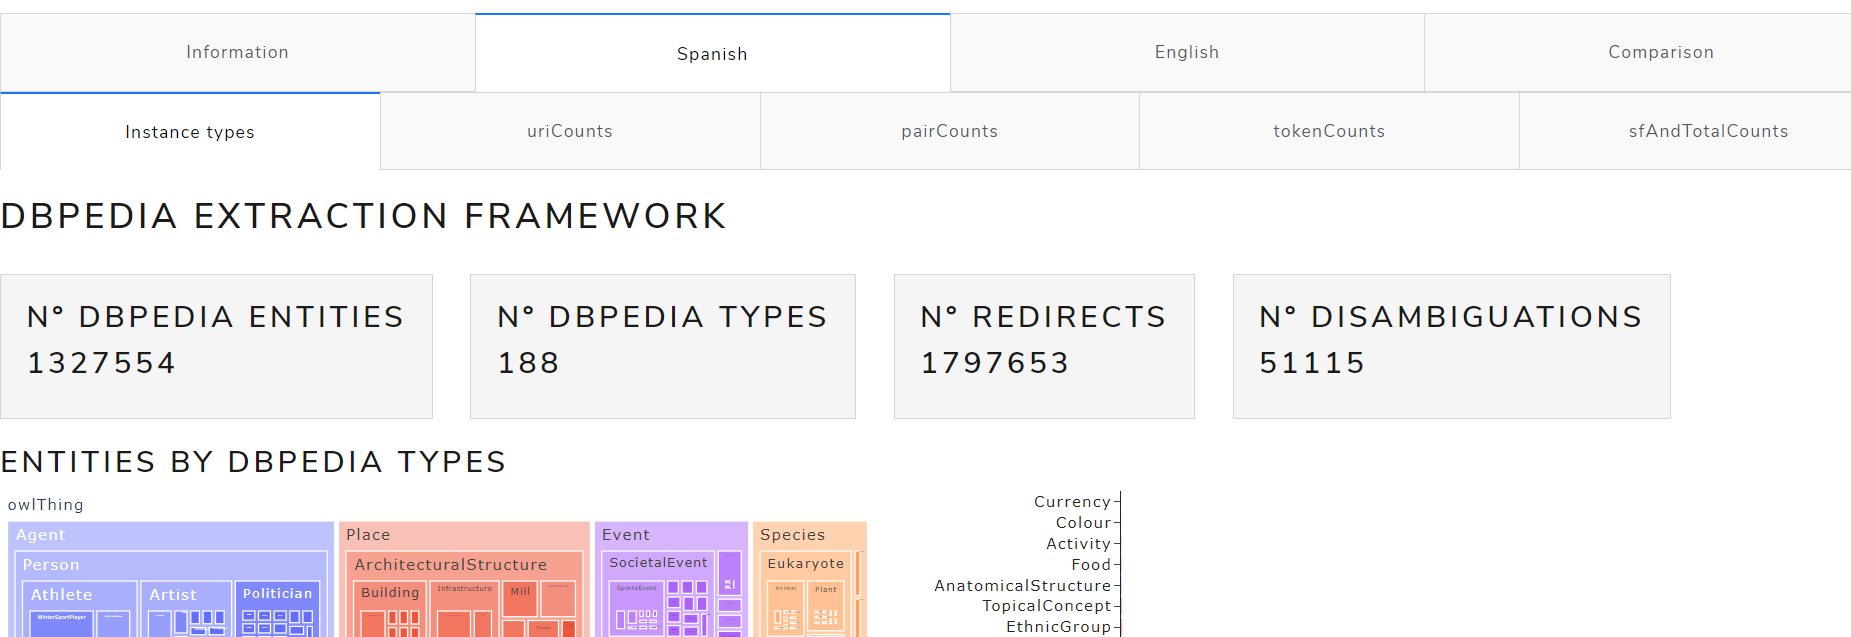
- Entities by DBpedia types
Figure 9 shows the entities by DBpedia types chart of May 2021 version for the English language .
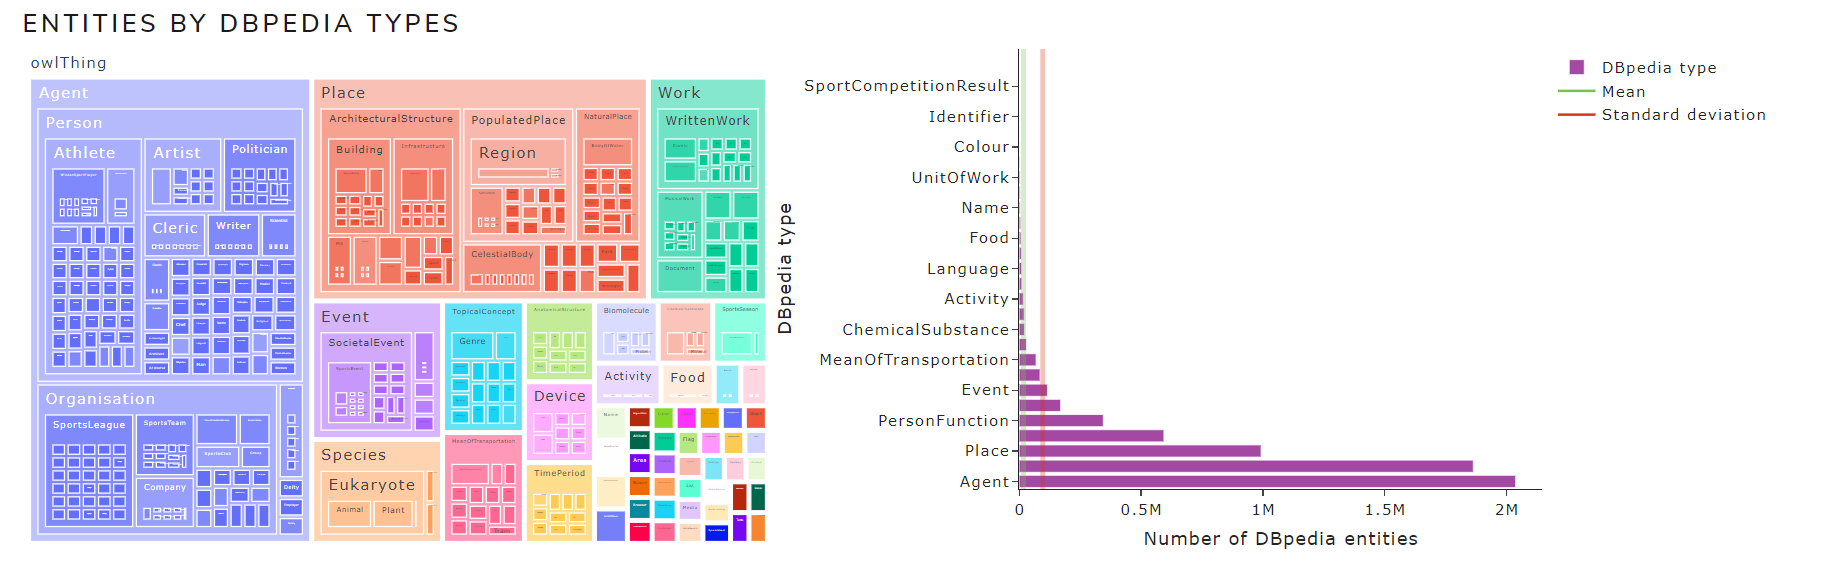 Figure 9. Entities by DBpedia types chart
Moreover, the following views can be seen in the DBpedia Spotlight section:
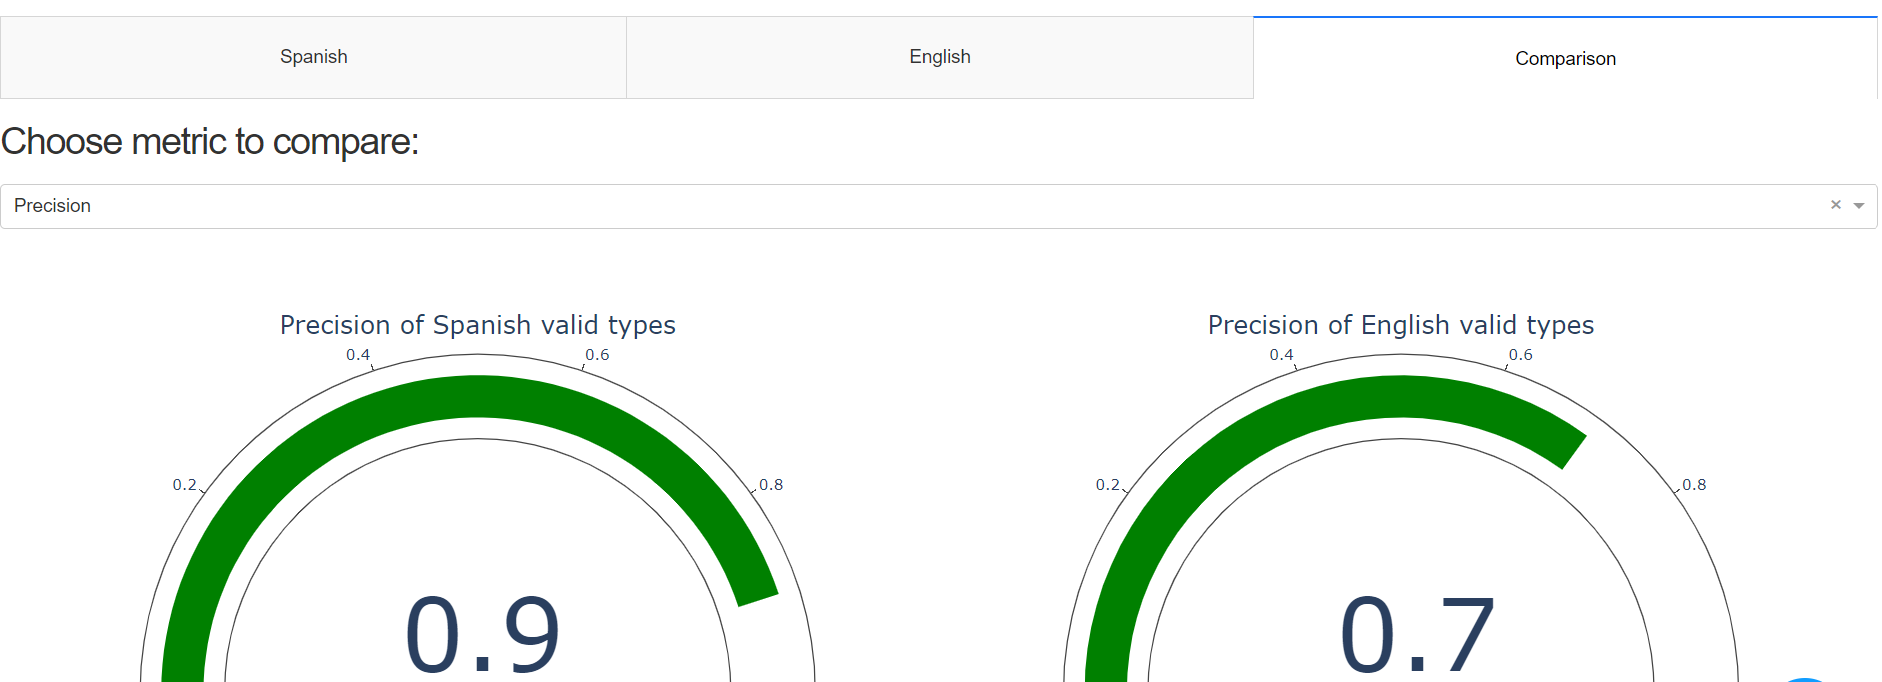
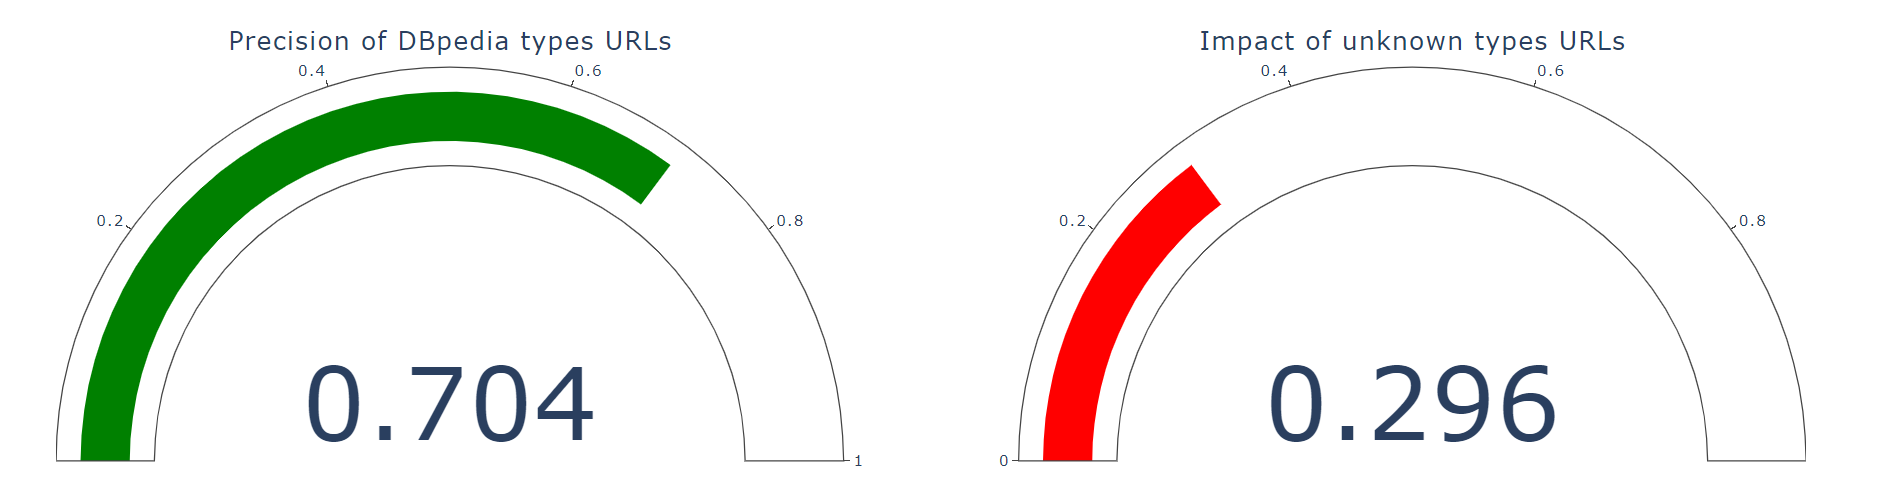
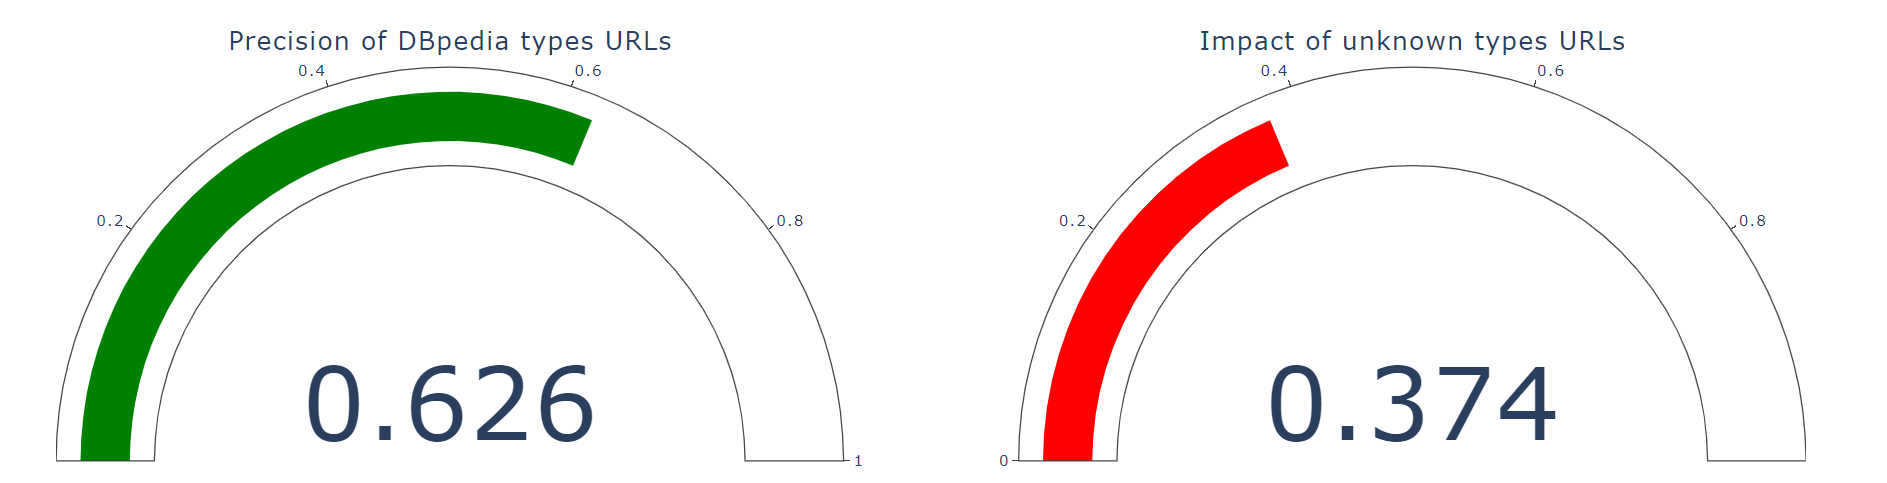
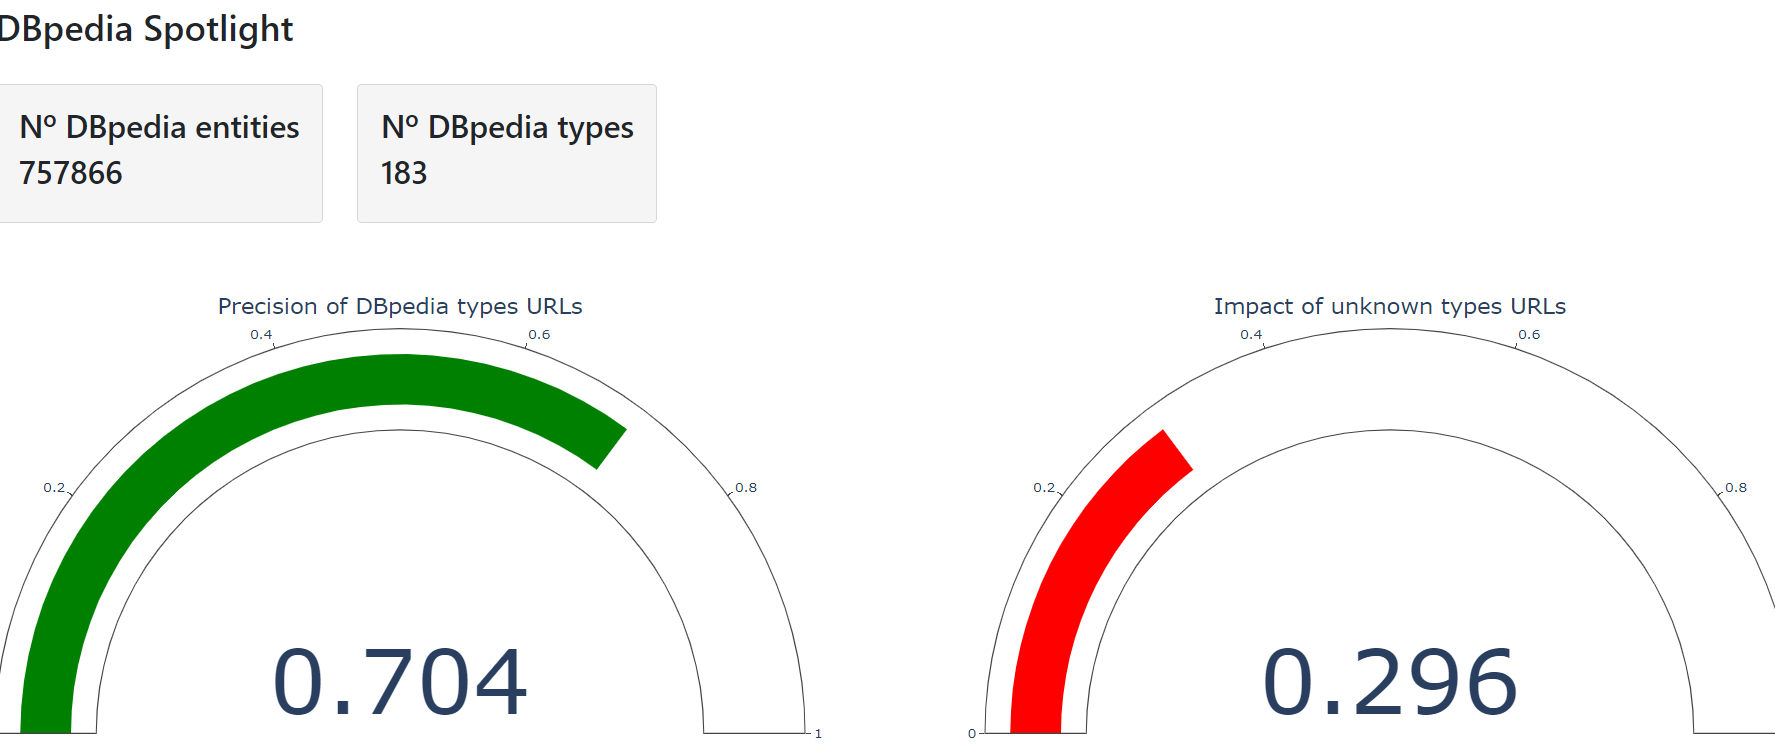
- Precision and impact calculated after
entity validation process
These measurements are used to find out which Spotlight entities have known DBpedia types and which entities have unknown types. They are calculated as follows:
Precision = Nº entities with known types / Nº entities
Impact = Nº entities with unknown types / Nº entities
In the Figure 10 it can be seen that 63% of entities present known types and 27% present unknown types in the case of English language in May 2021 version
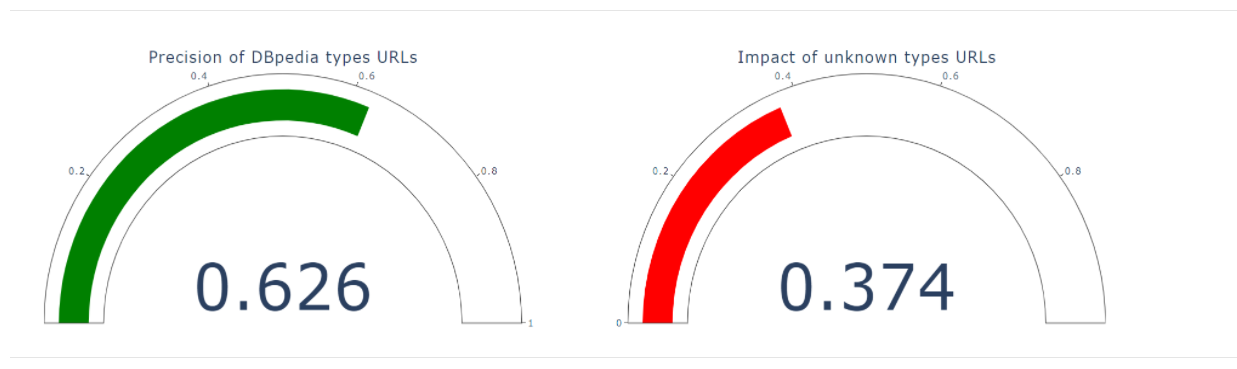 Figure 10. Precision and Impact indicators
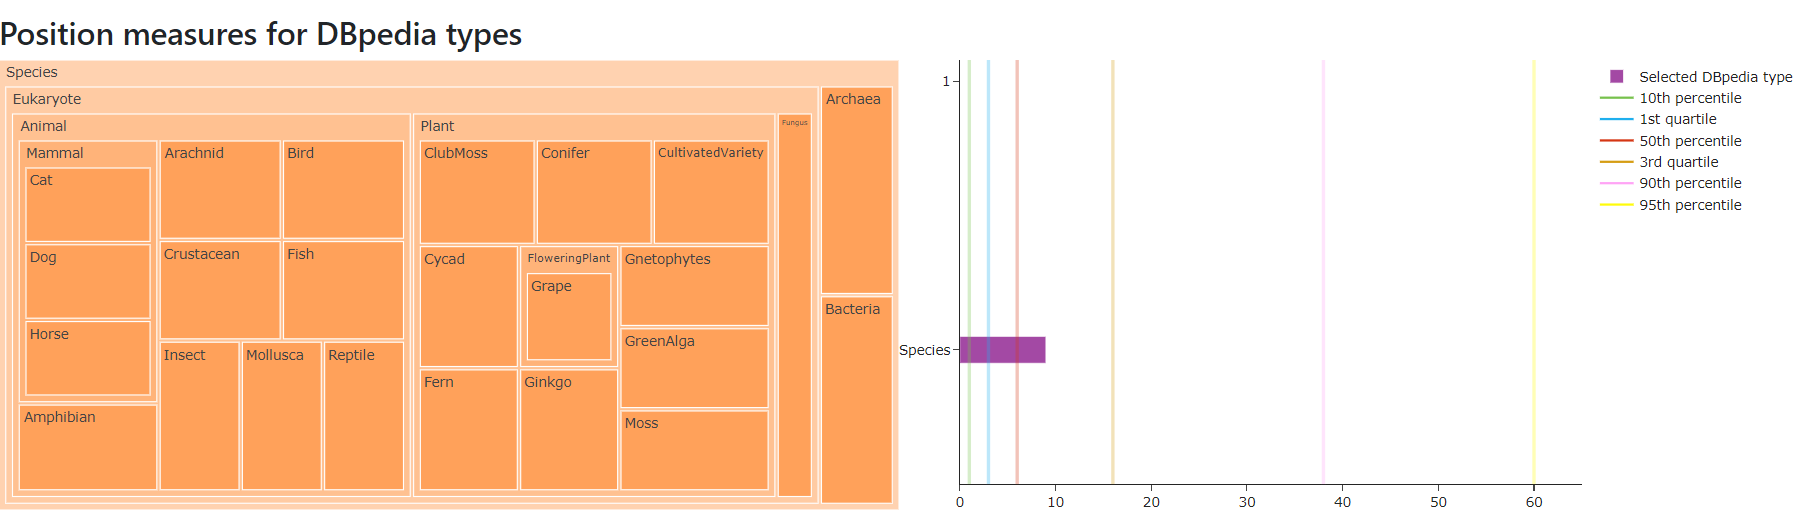
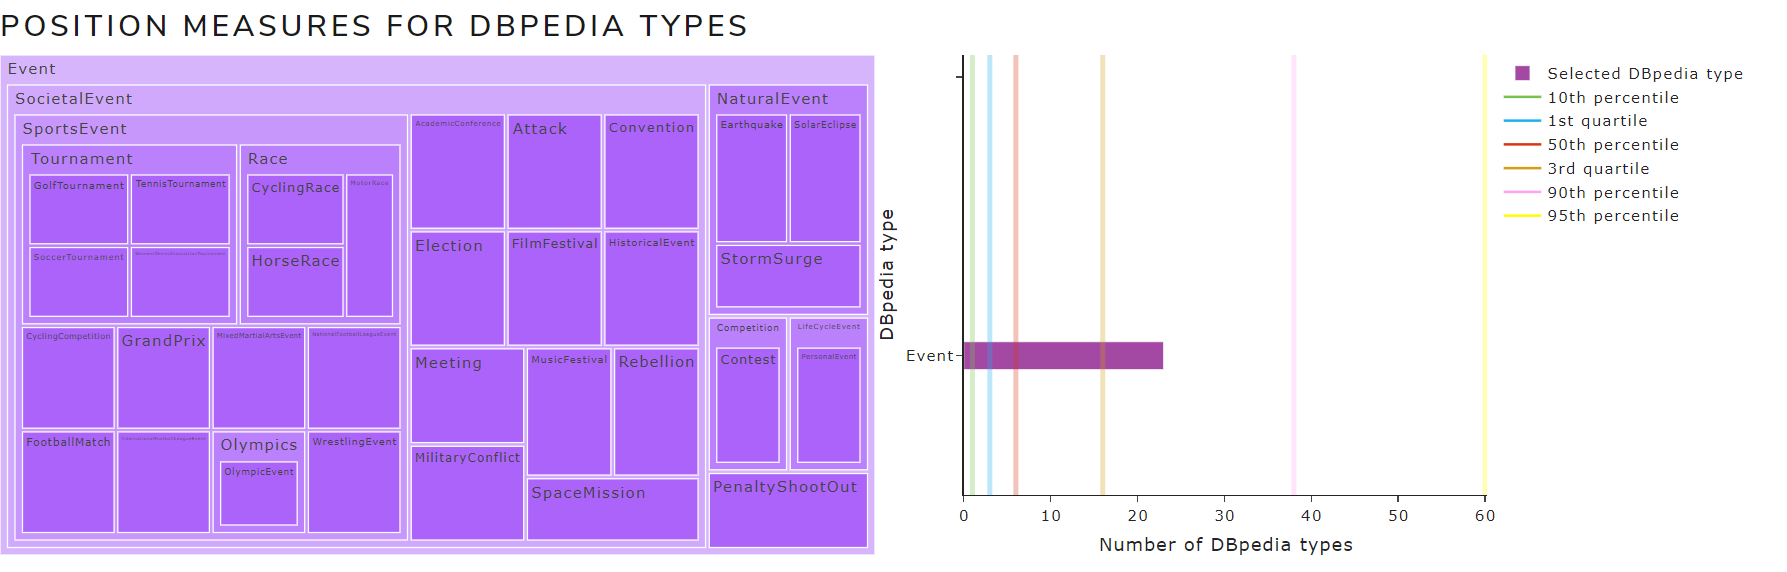
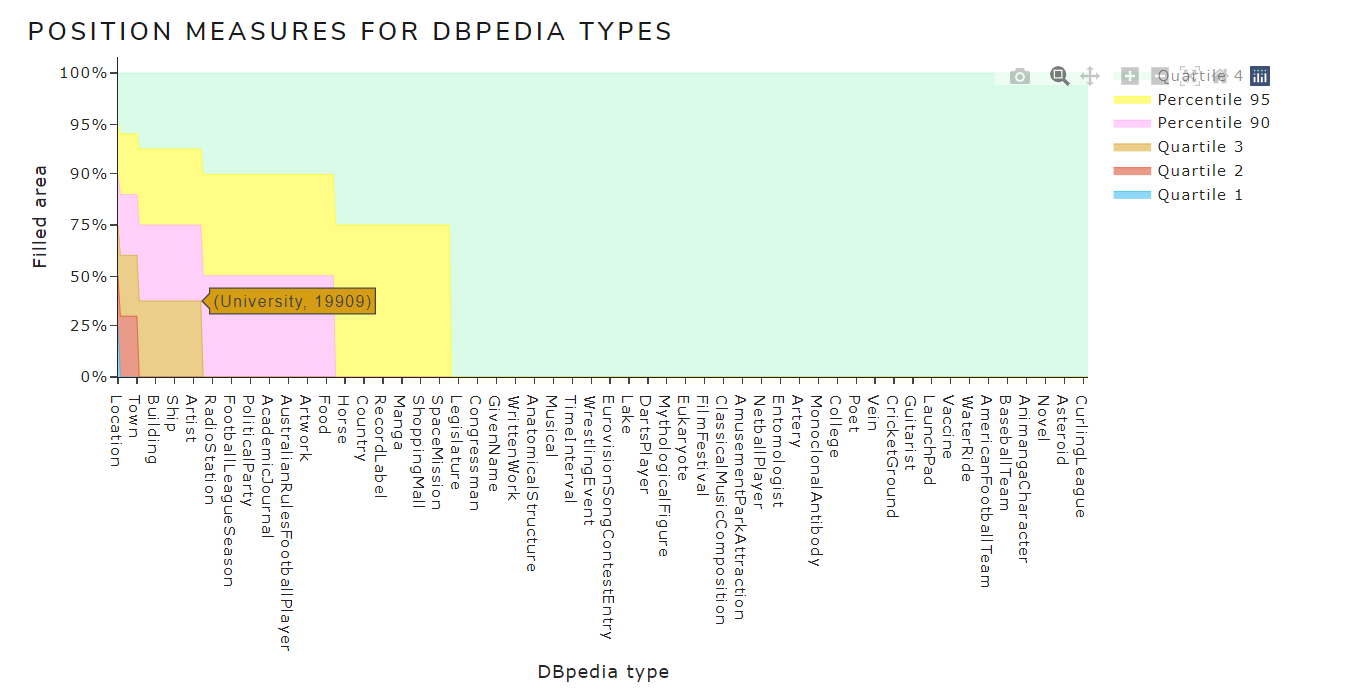
- Position measures for DBpedia types (quartiles and percentiles)
Figure 11 shows the position measures for DBpedia types chart of May 2021 version for the English language .
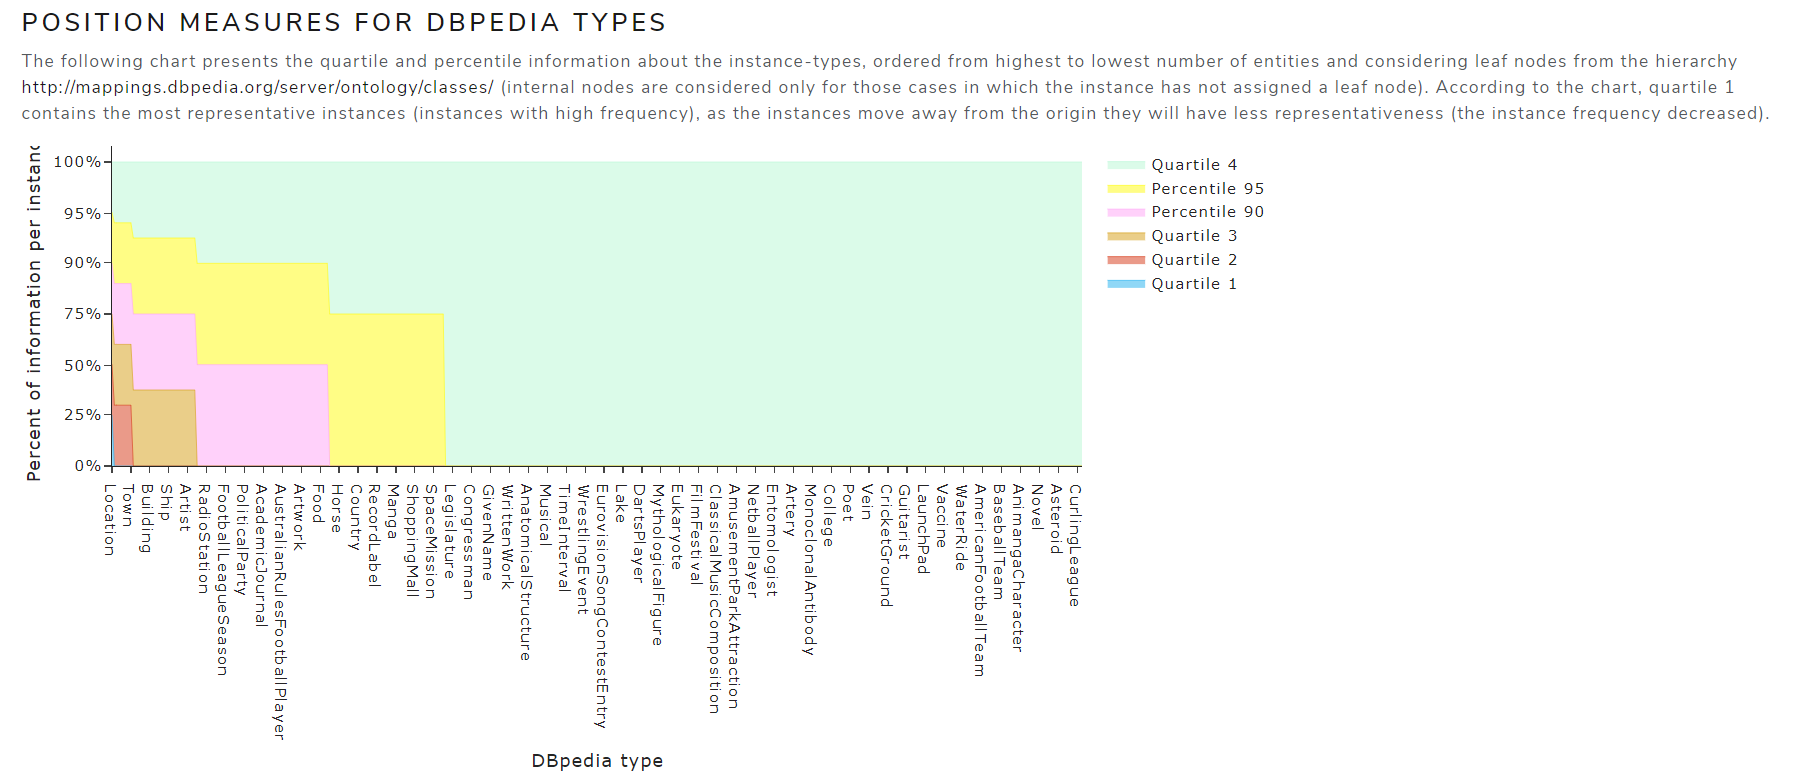 Figure 11. Position measures for DBpedia types
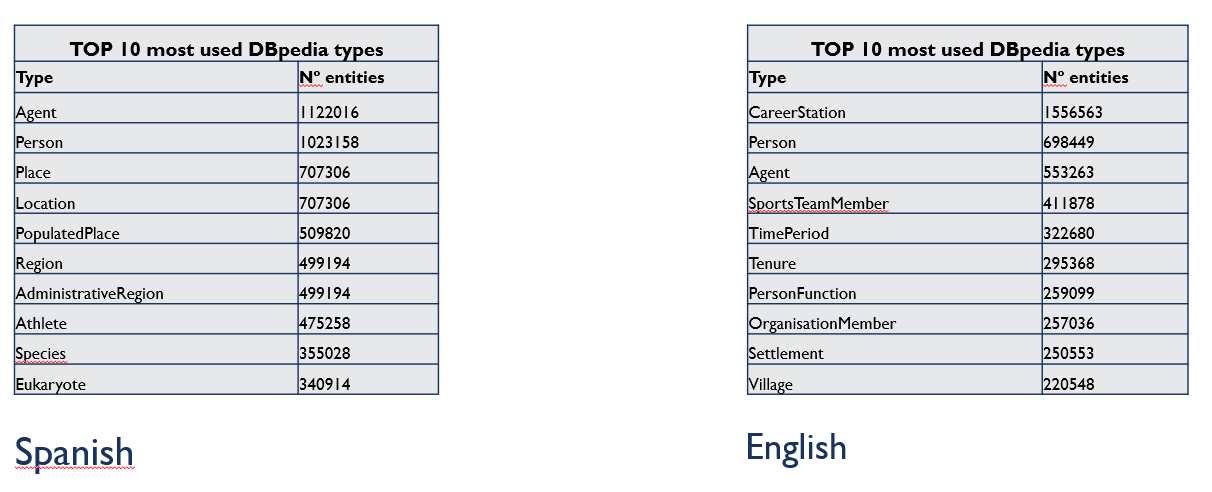
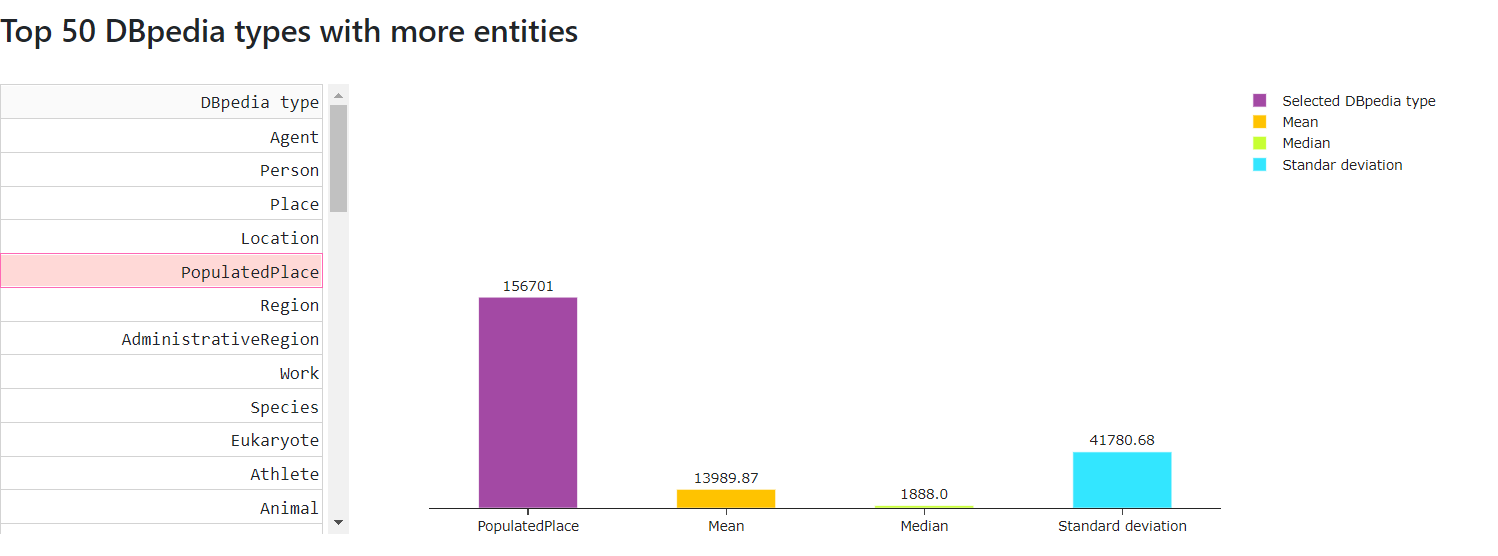
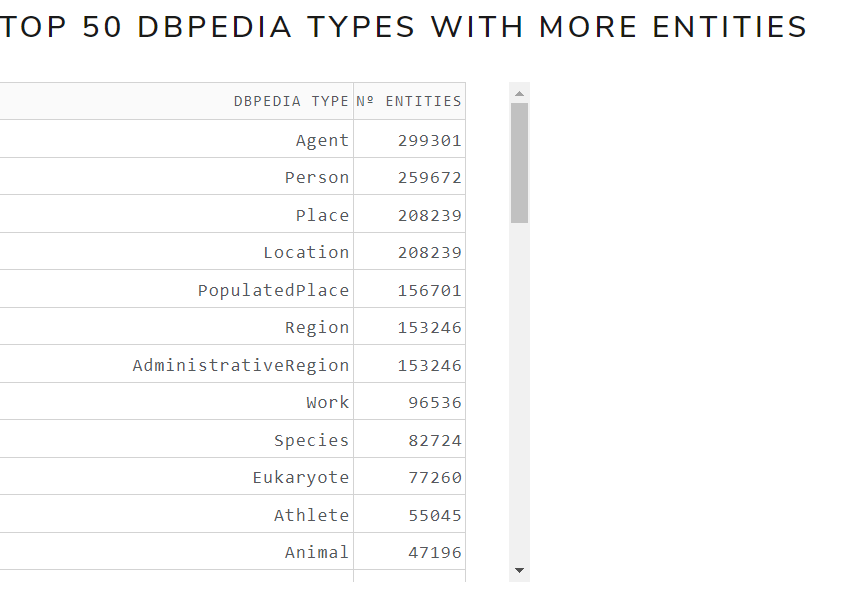
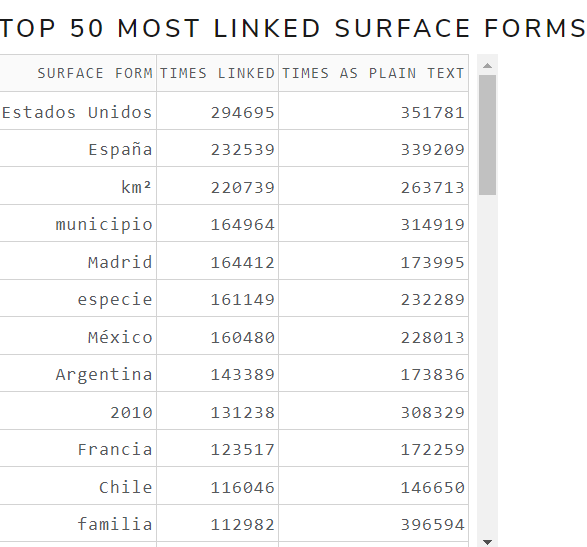
- Top 50 DBpedia types with more entities
Figure 12 shows the top 50 DBpedia types with more entities table of May 2021 version for the English language .
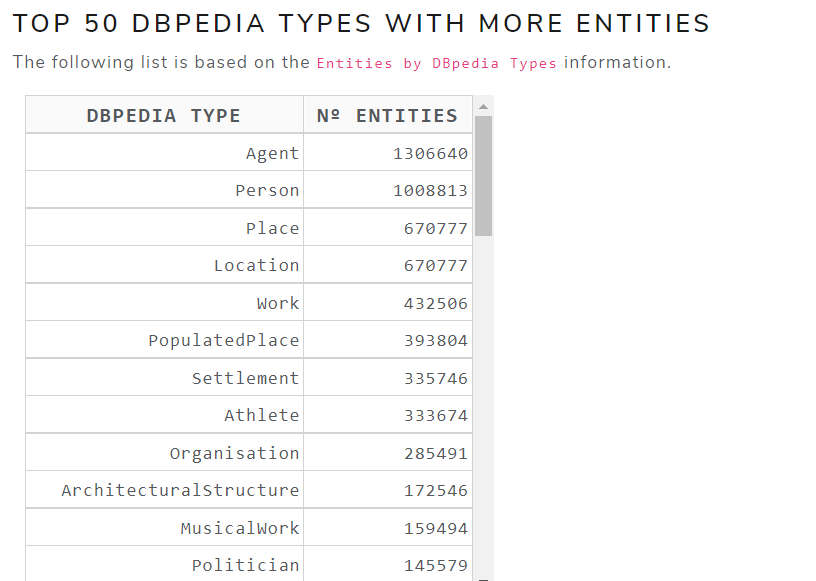 Figure 12. Top 50 DBpedia types with more entities
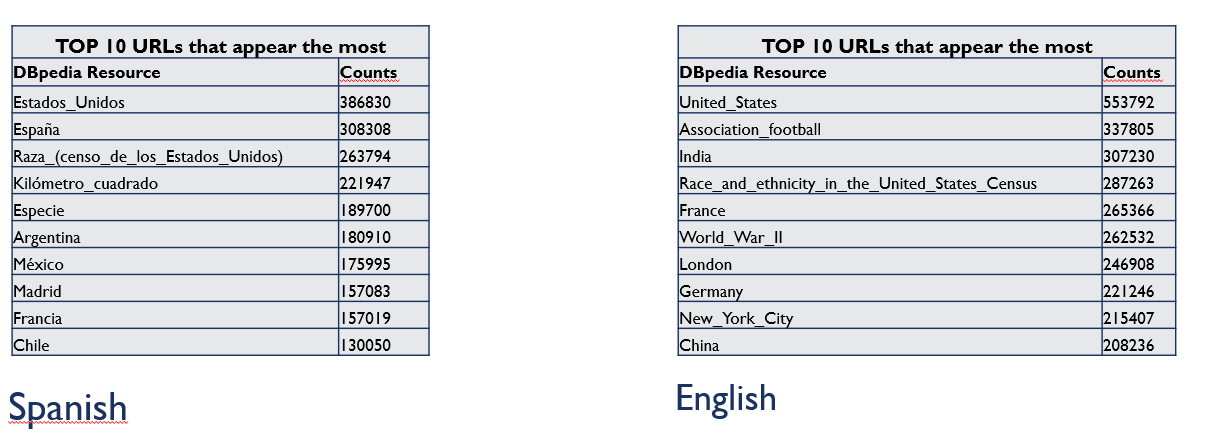
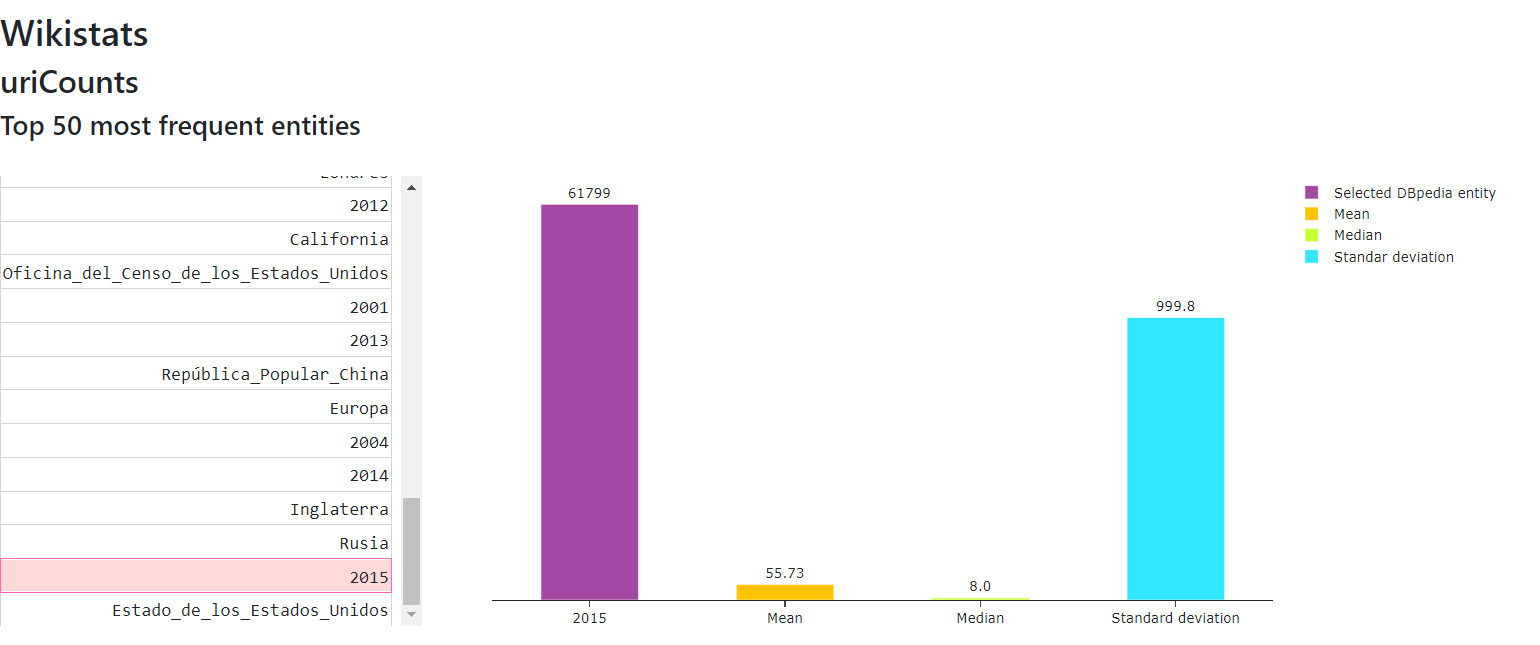
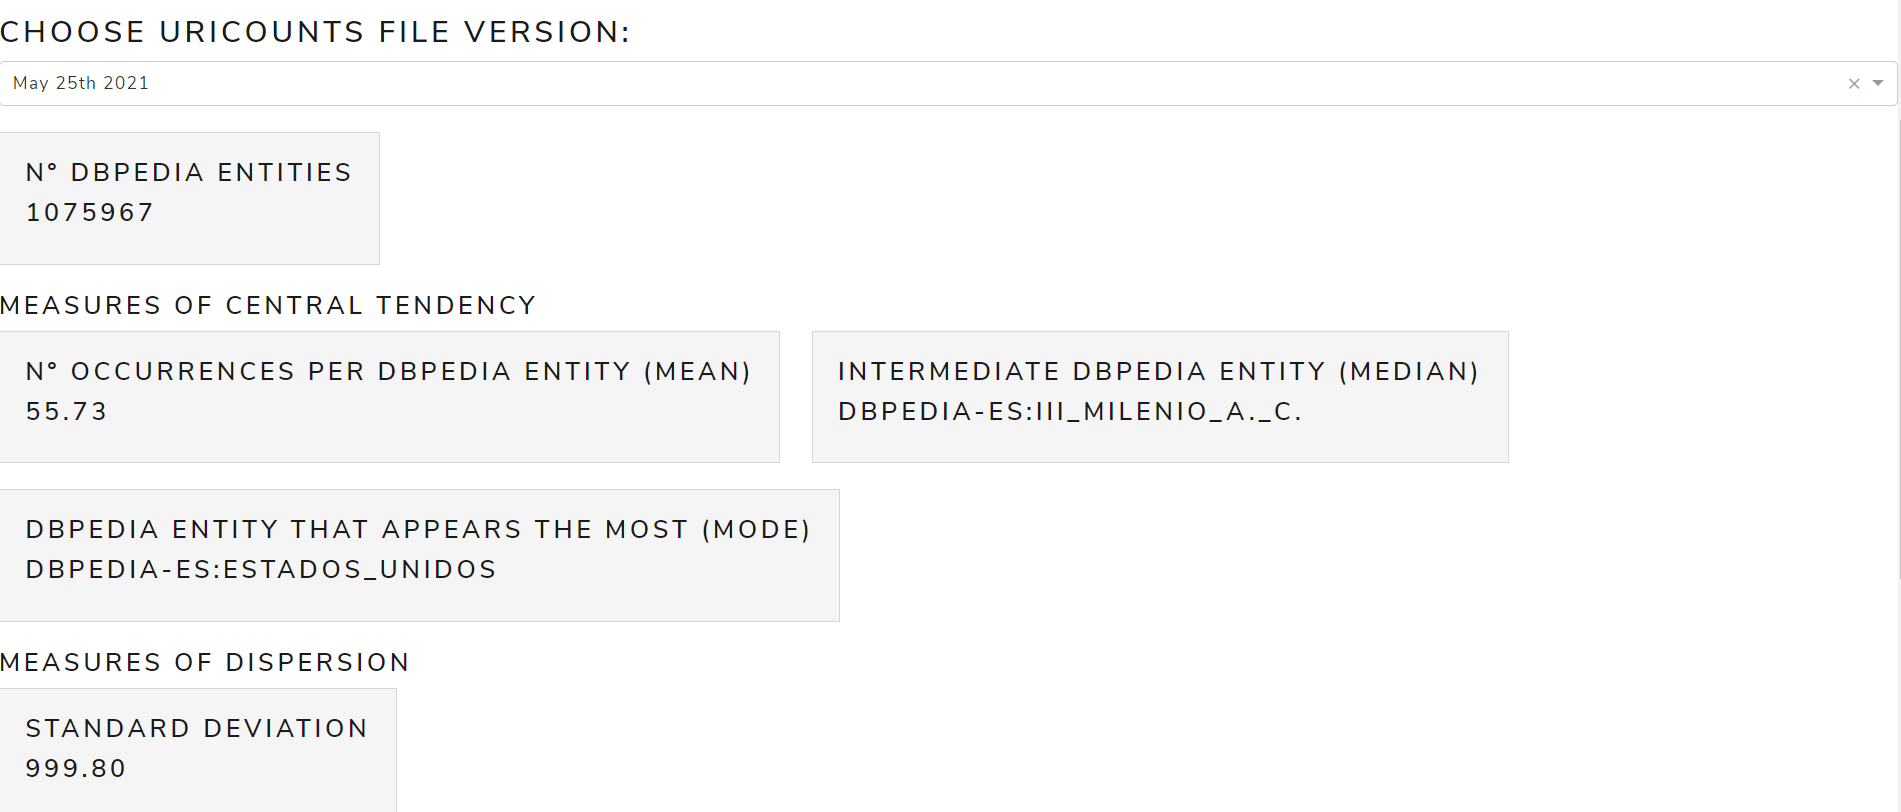
uriCounts
Allows to see metrics calculated from the uriCounts file
The main measures are:
- Measures of Central Tendency: mean, mode, median
- Measures of Dispersion: standard deviation
Figure 13 shows the calculated measures of central tendency and dispersion from uriCounts file of May 2021 version for the English language .
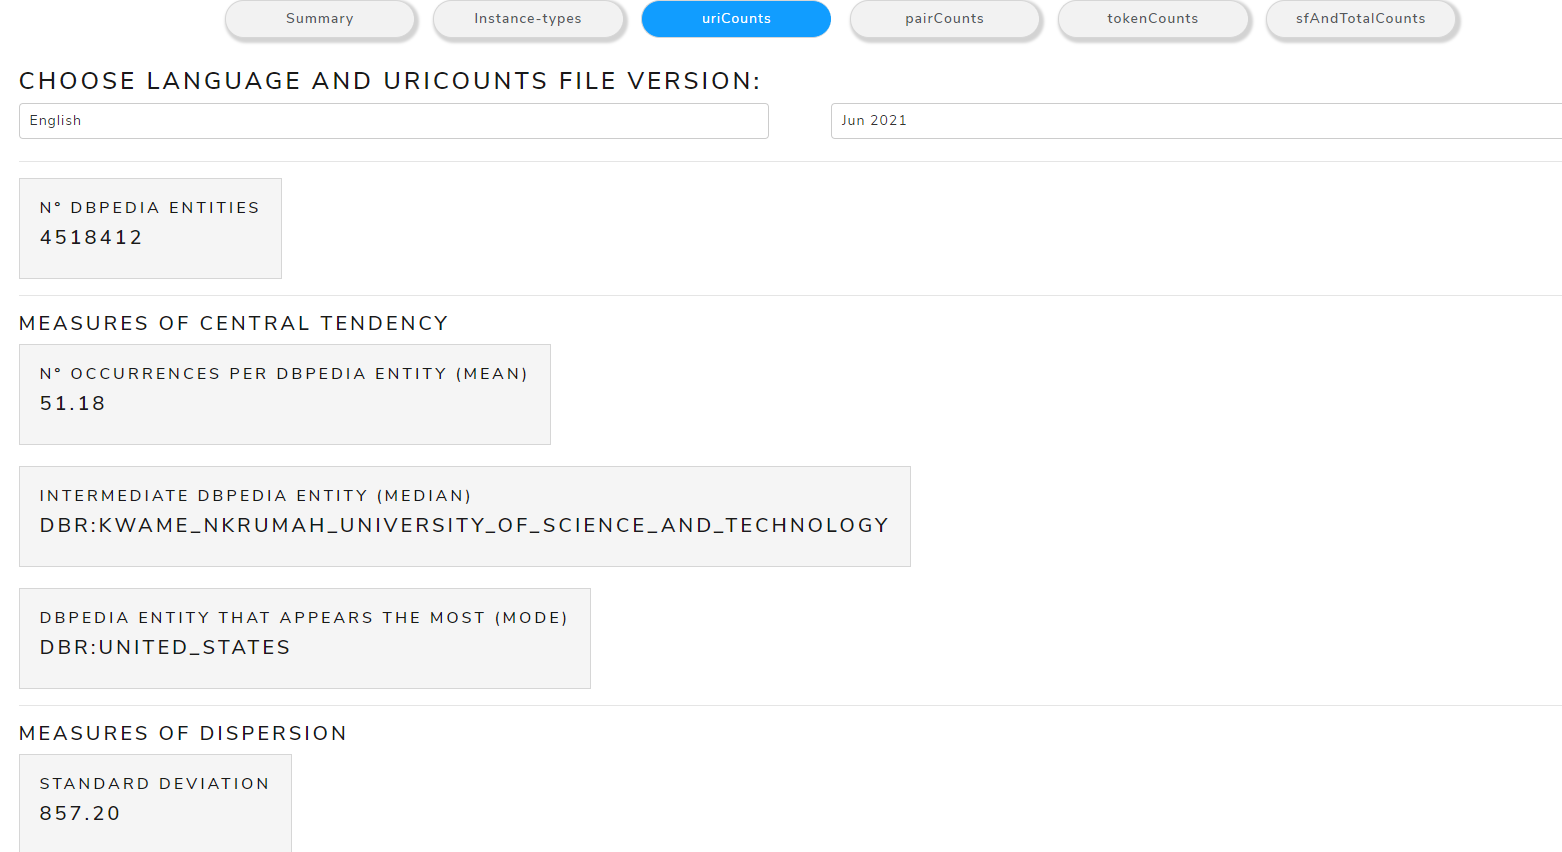 Figure 13. Calculated measures from uriCounts file
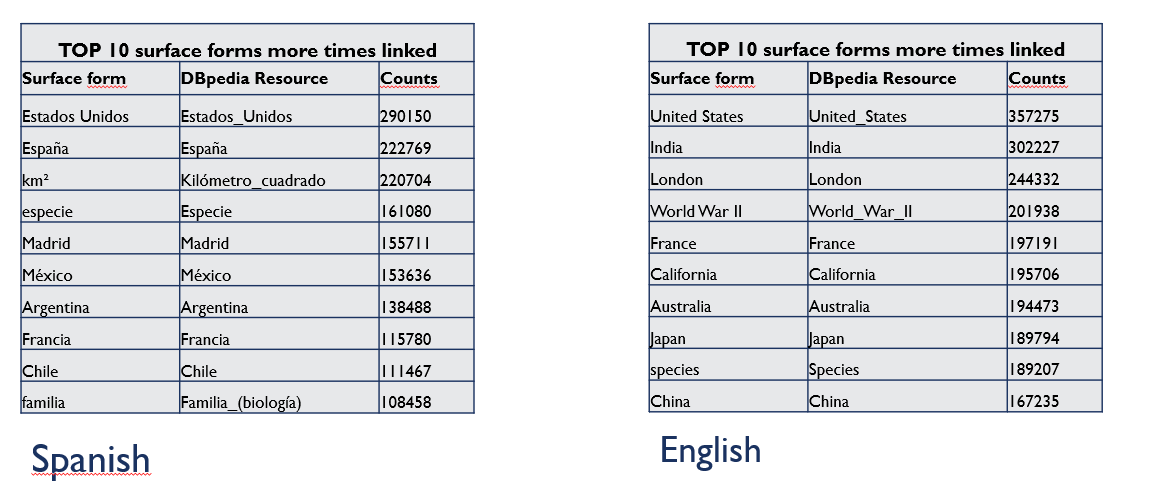
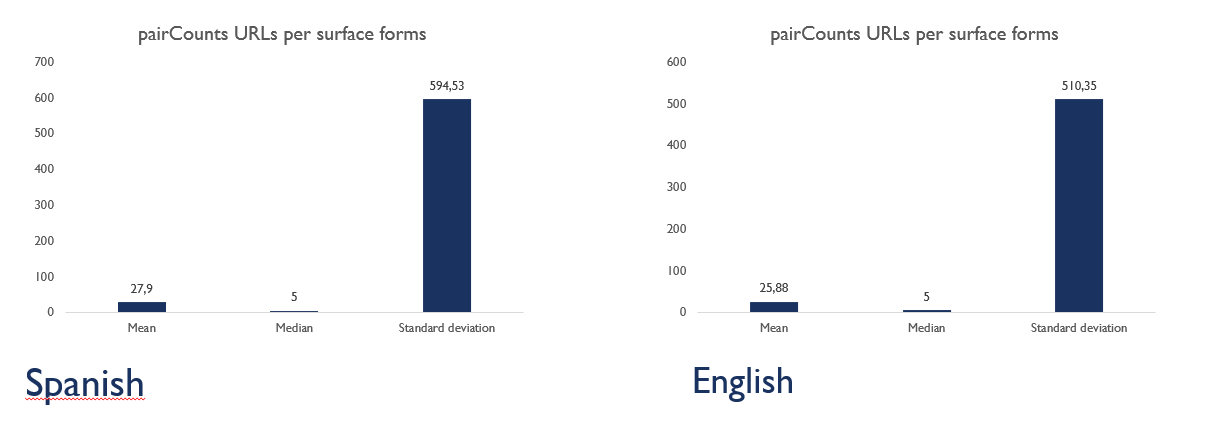
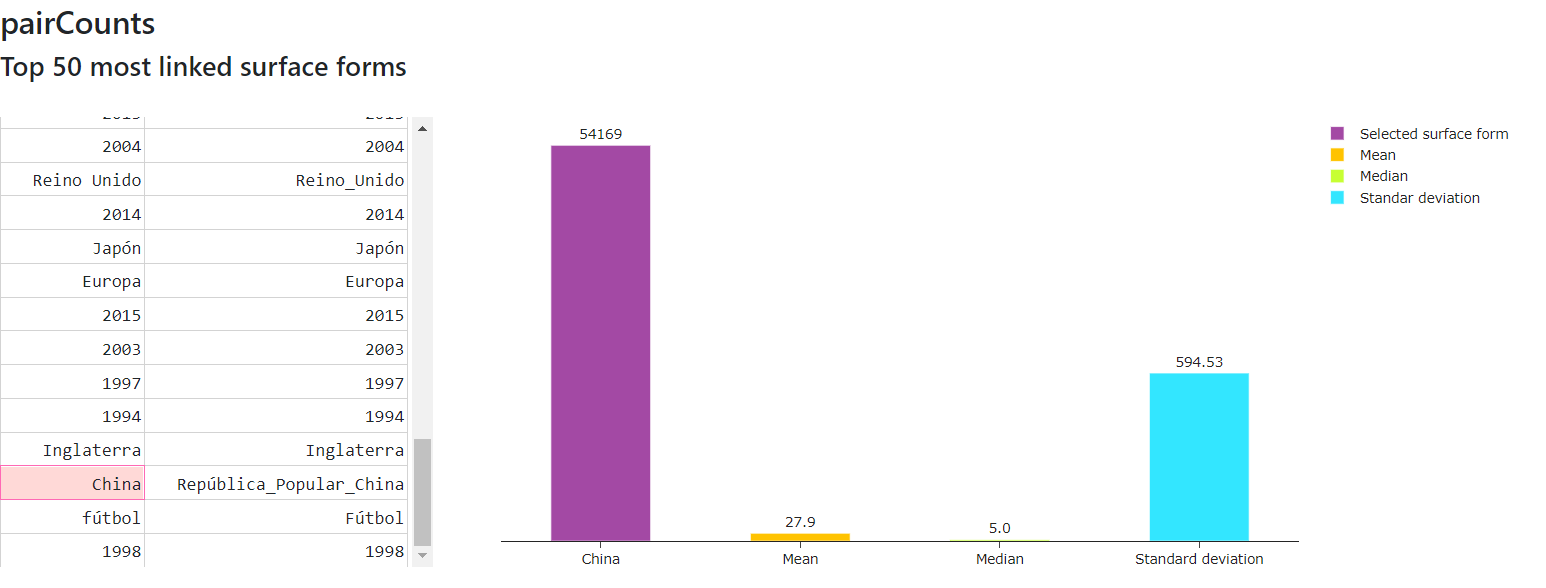
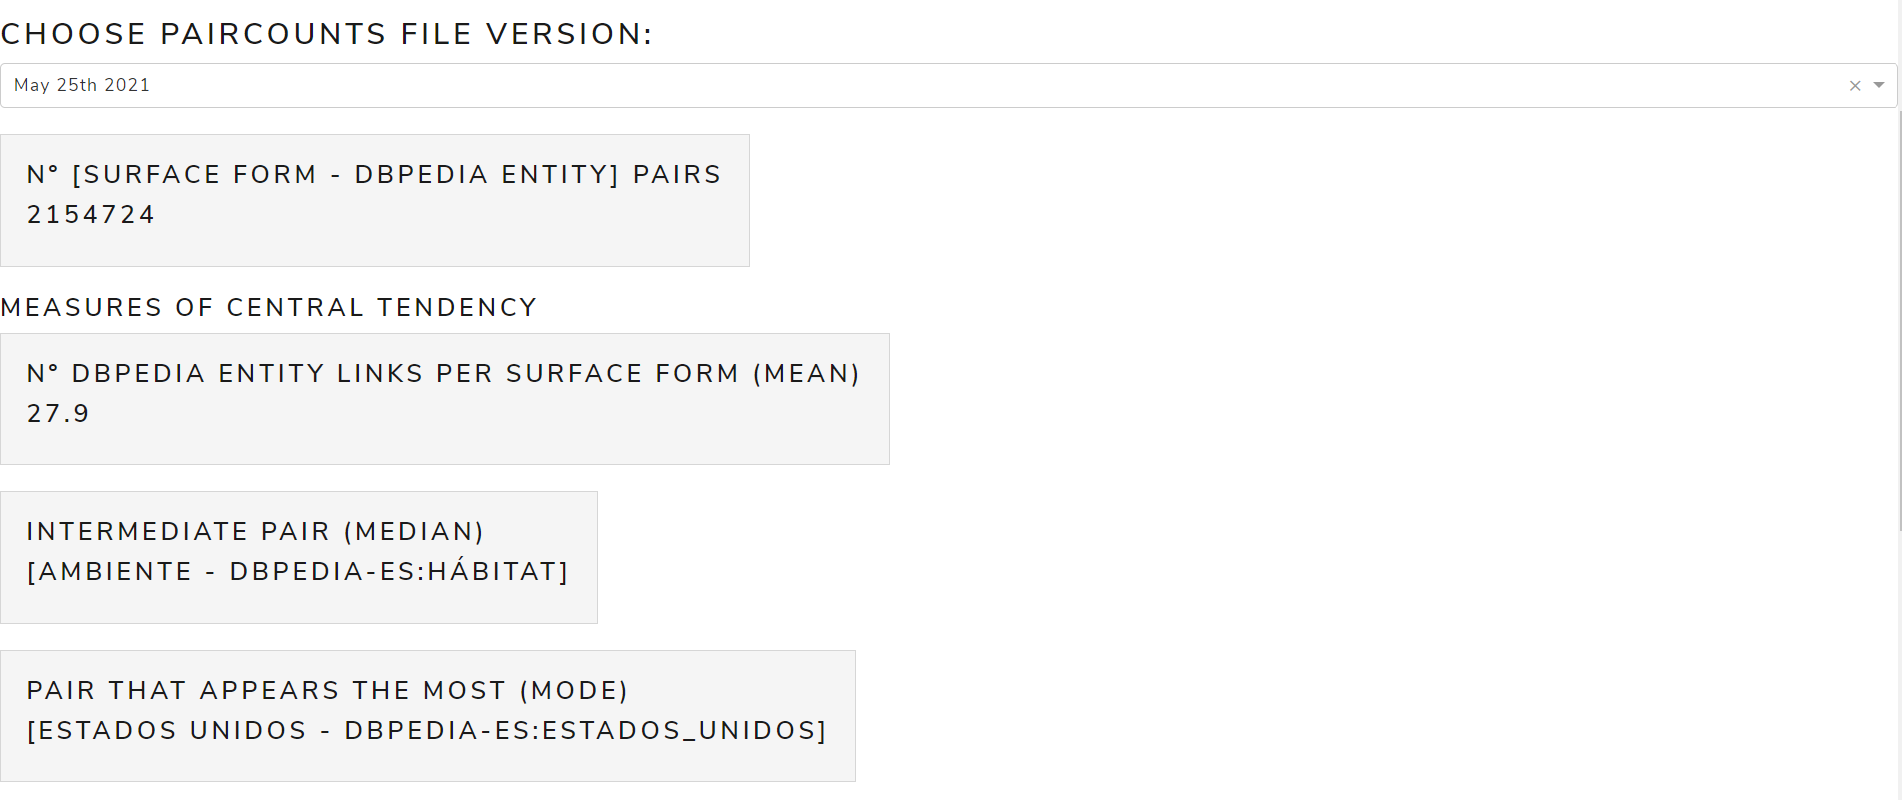
pairCounts
Allows to see metrics calculated from the pairCounts file
The main measures are:
- Measures of Central Tendency: mean, mode, median
- Measures of Dispersion: standard deviation
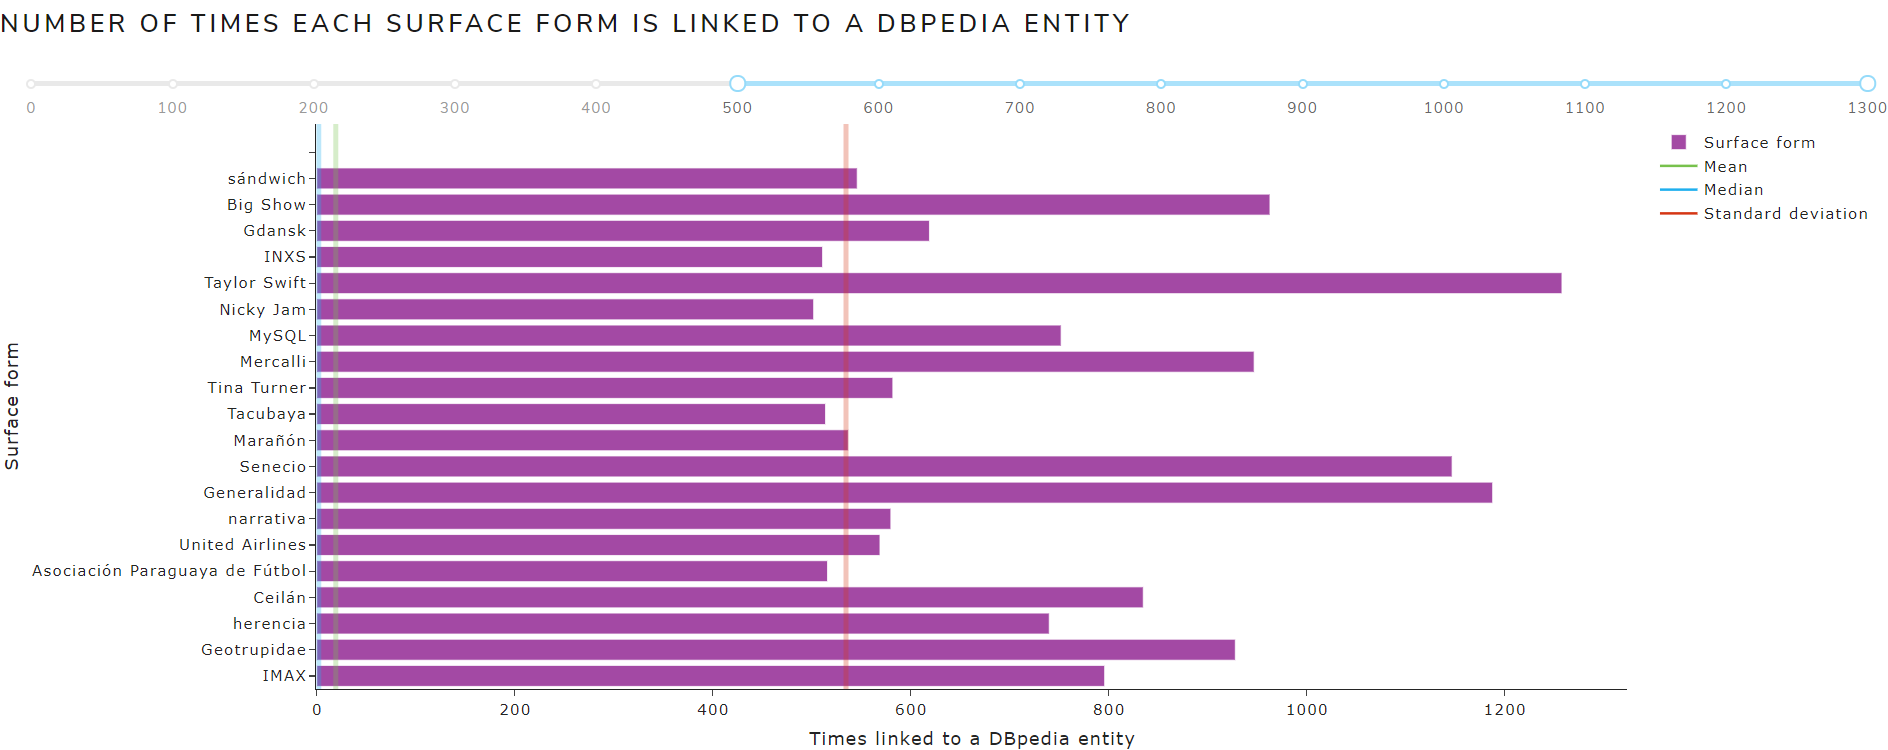
Figure 14 shows the calculated measures of central tendency and dispersion from pairCounts file of May 2021 version for the English language .
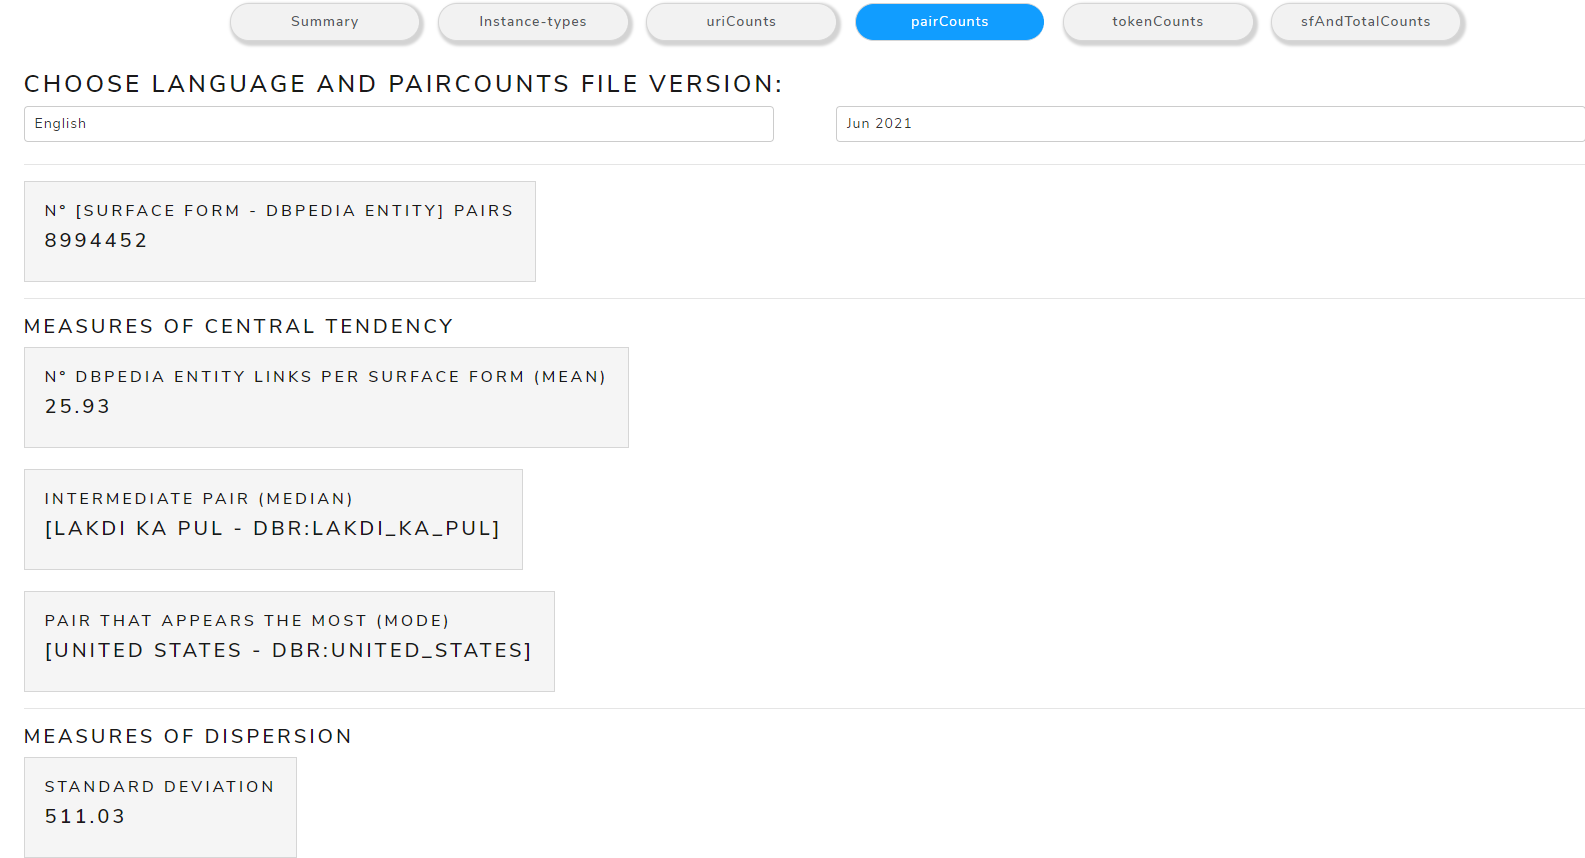 Figure 14. Calculated measures from pairCounts file
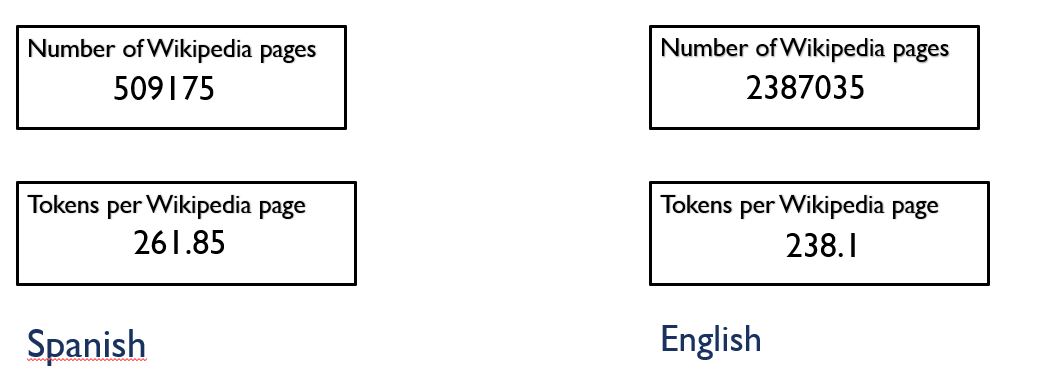
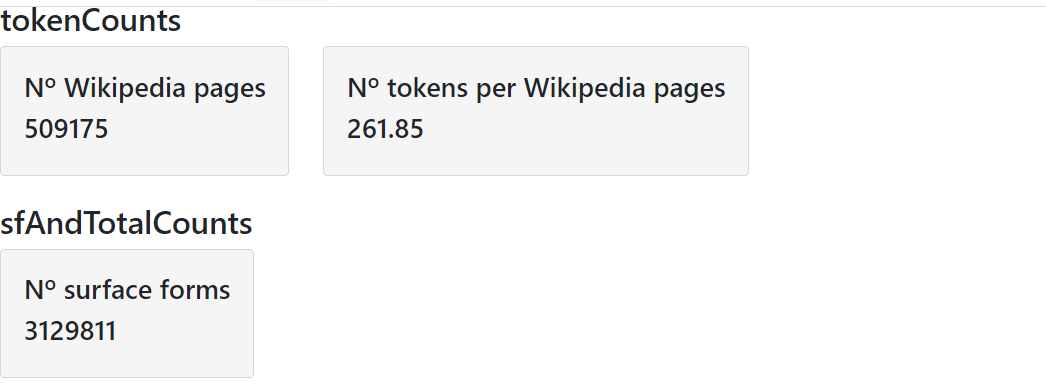
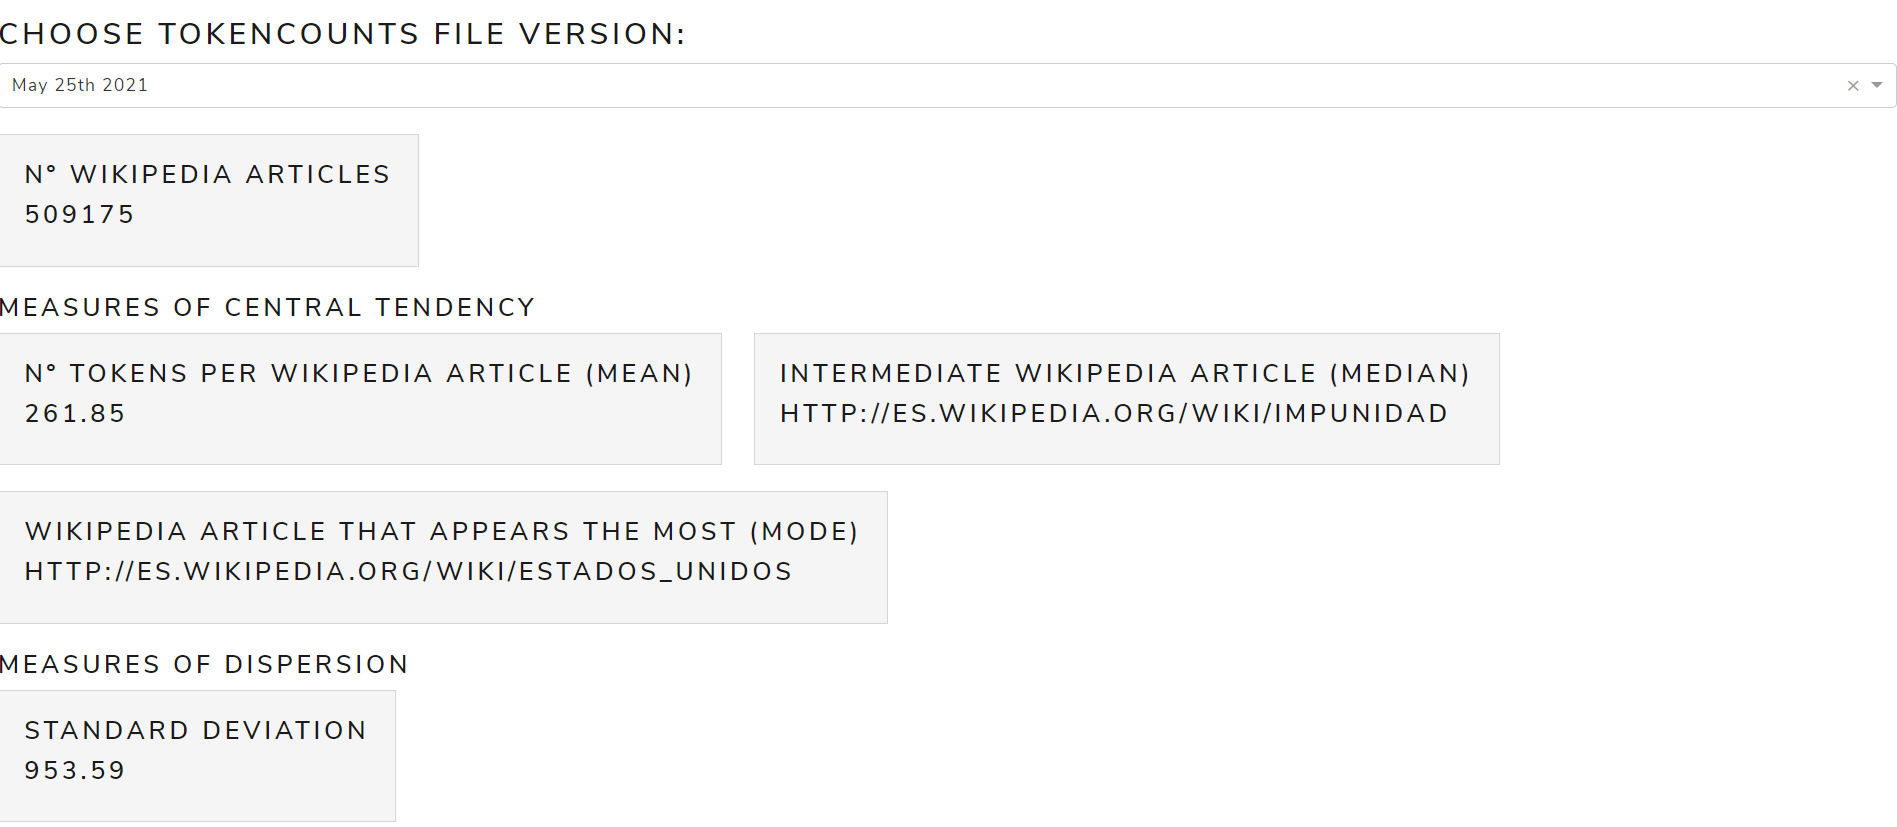
tokenCounts
Allows to see metrics calculated from the tokenCounts file
The main measures are:
- Measures of Central Tendency: mean, mode, median
- Measures of Dispersion: standard deviation
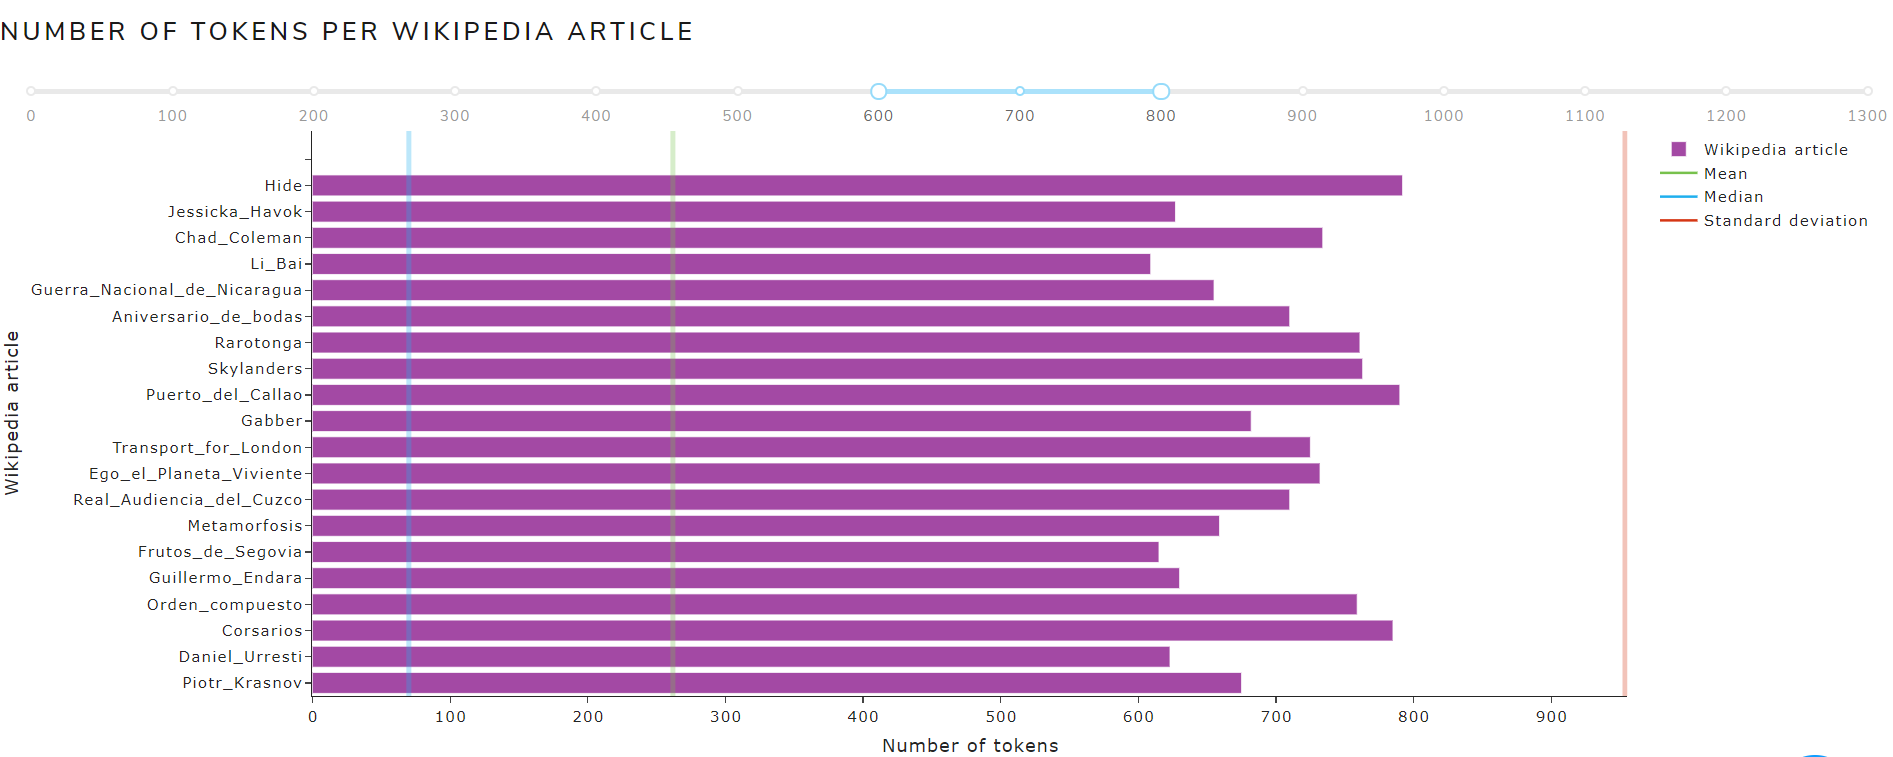
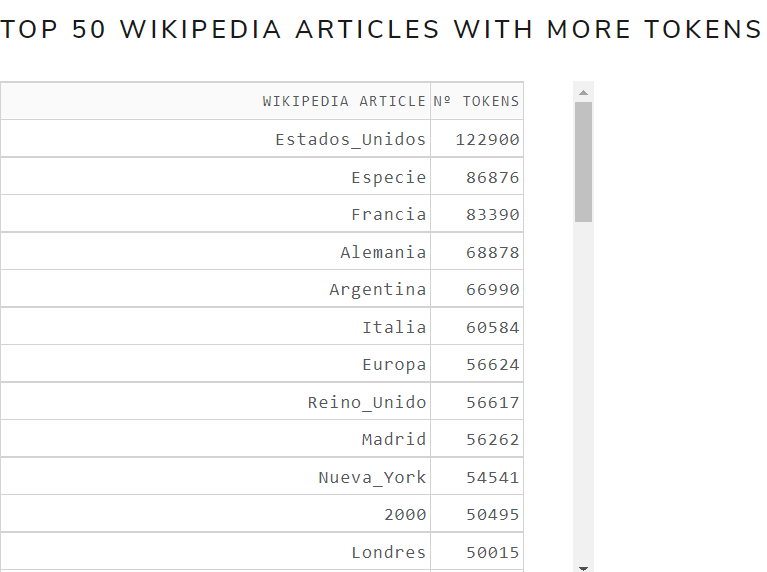
Figure 15 shows the calculated measures of central tendency and dispersion from tokenCounts file of May 2021 version for the English language .
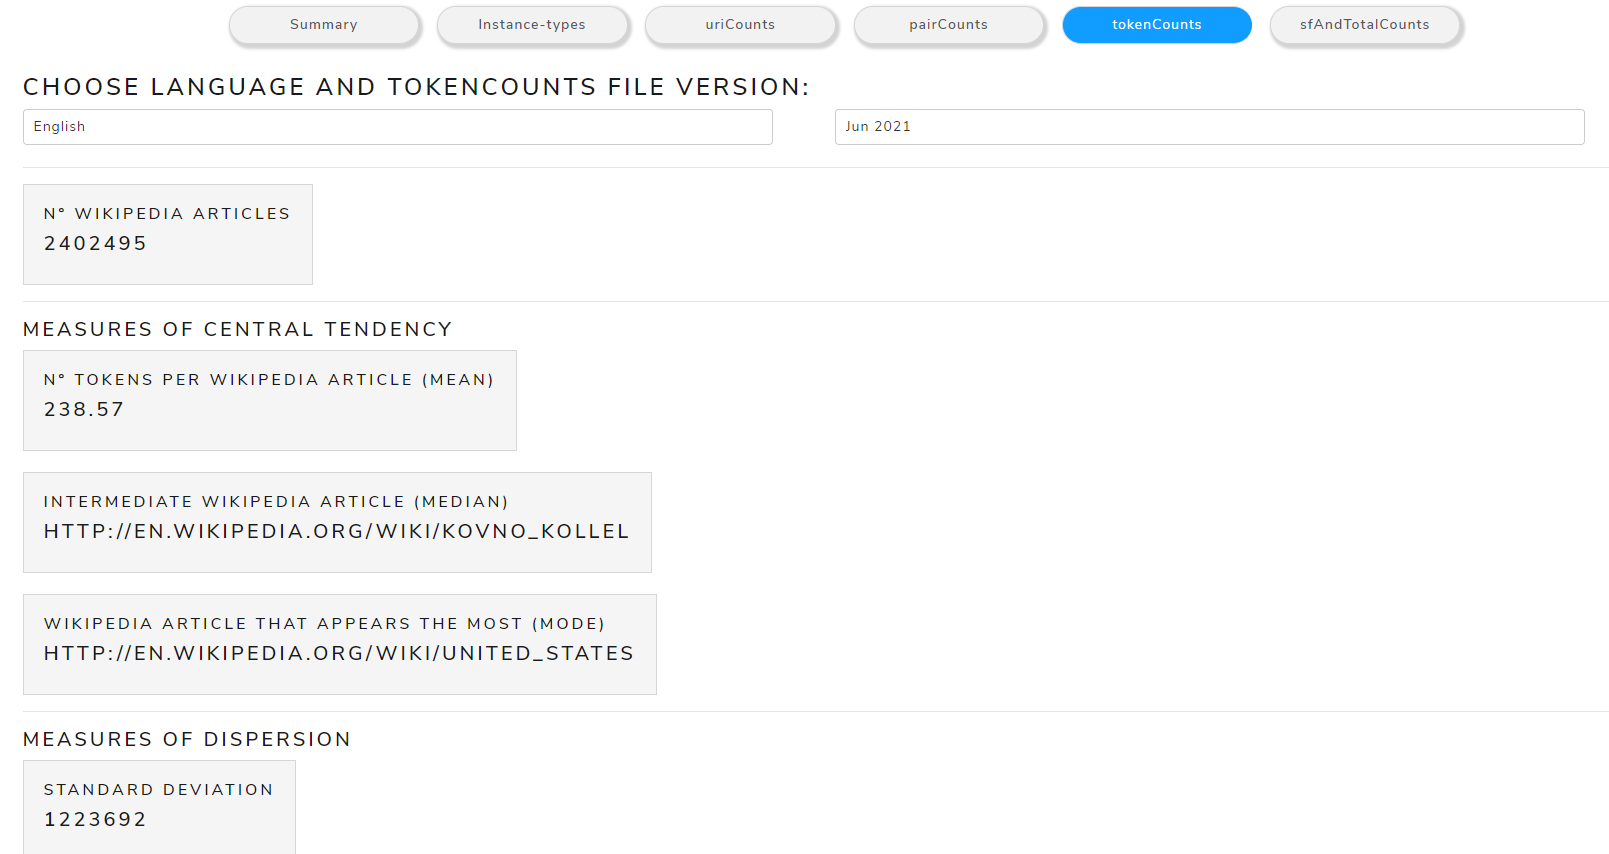 Figure 15. Calculated measures from tokenCounts file
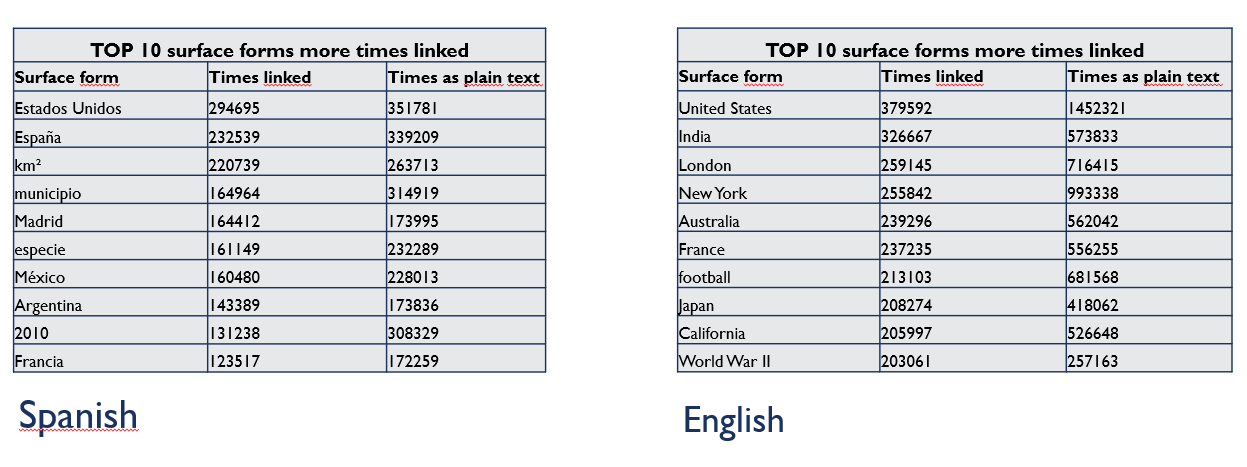
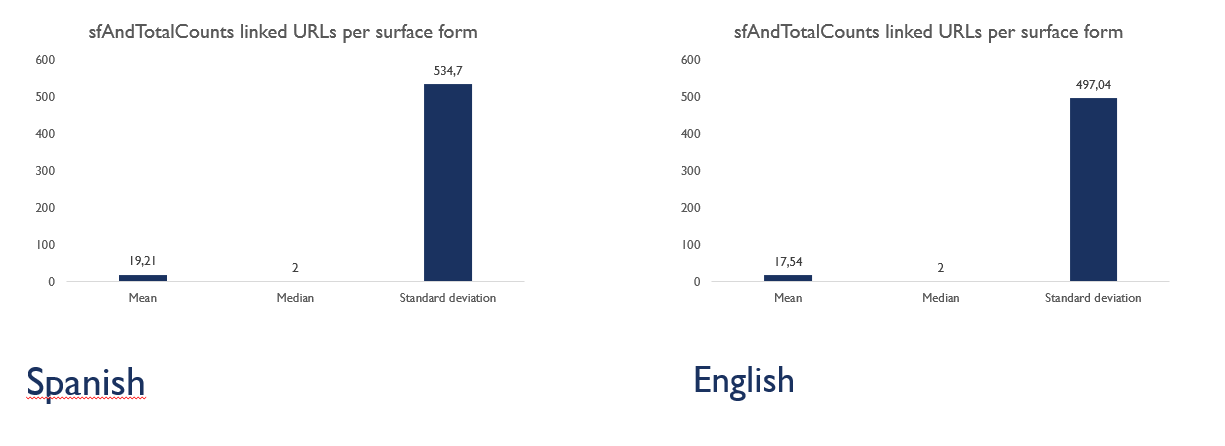
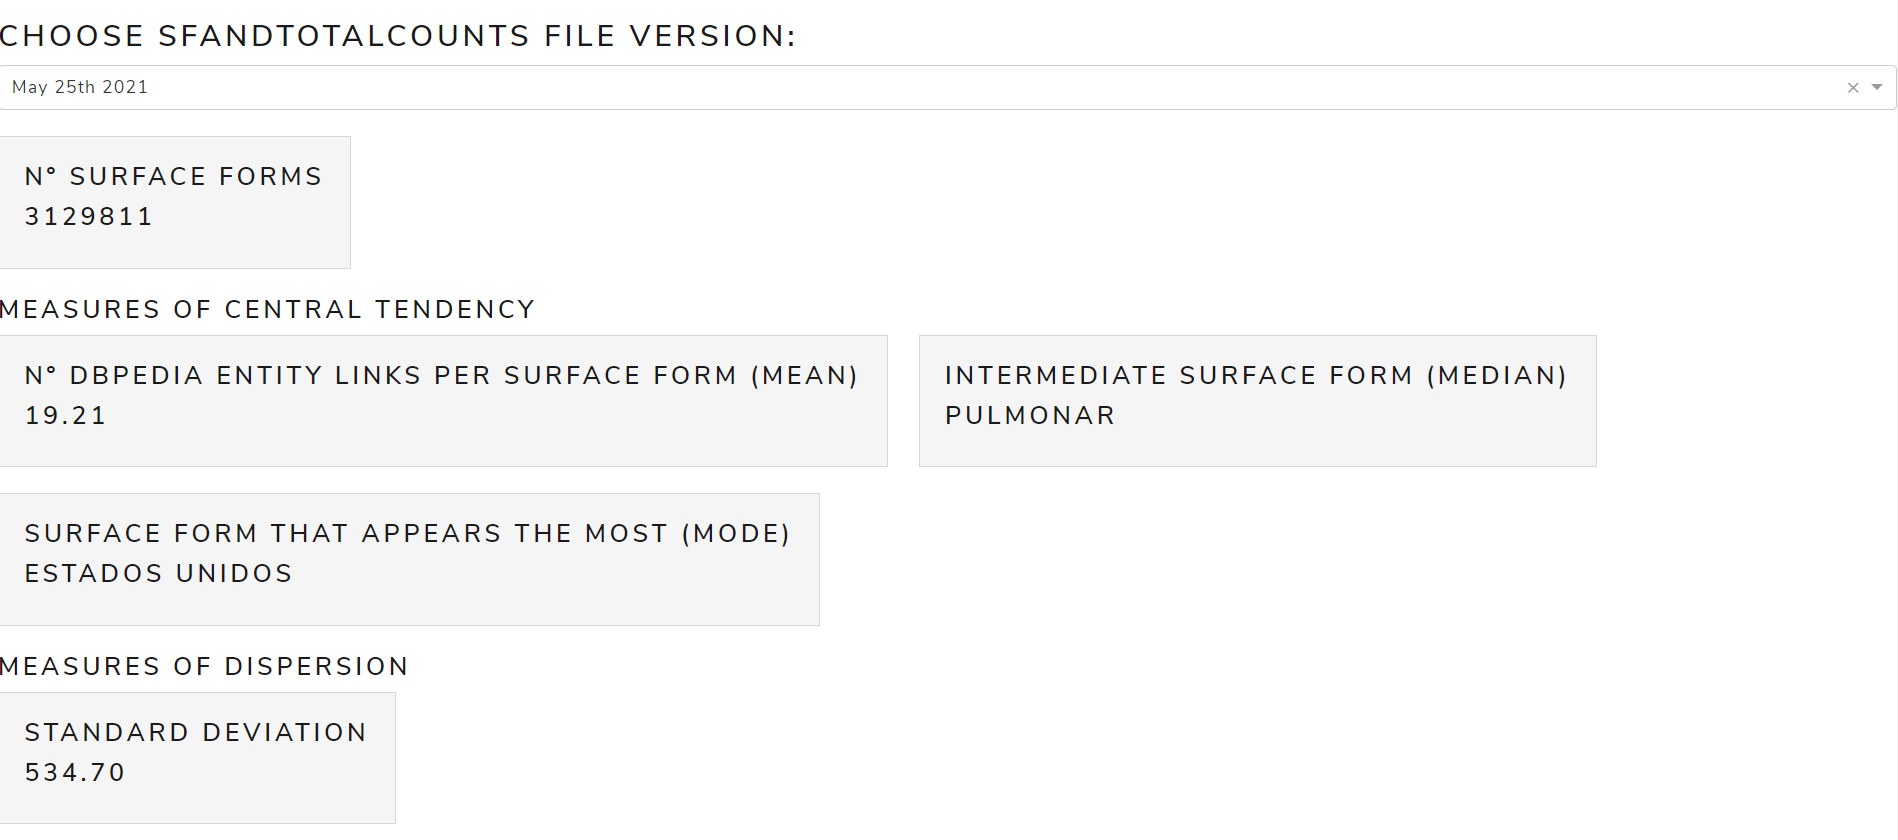
sfAndTotalCounts
Allows to see metrics calculated from the sfAndTotalCounts file
The main measures are:
- Measures of Central Tendency: mean, mode, median
- Measures of Dispersion: standard deviation
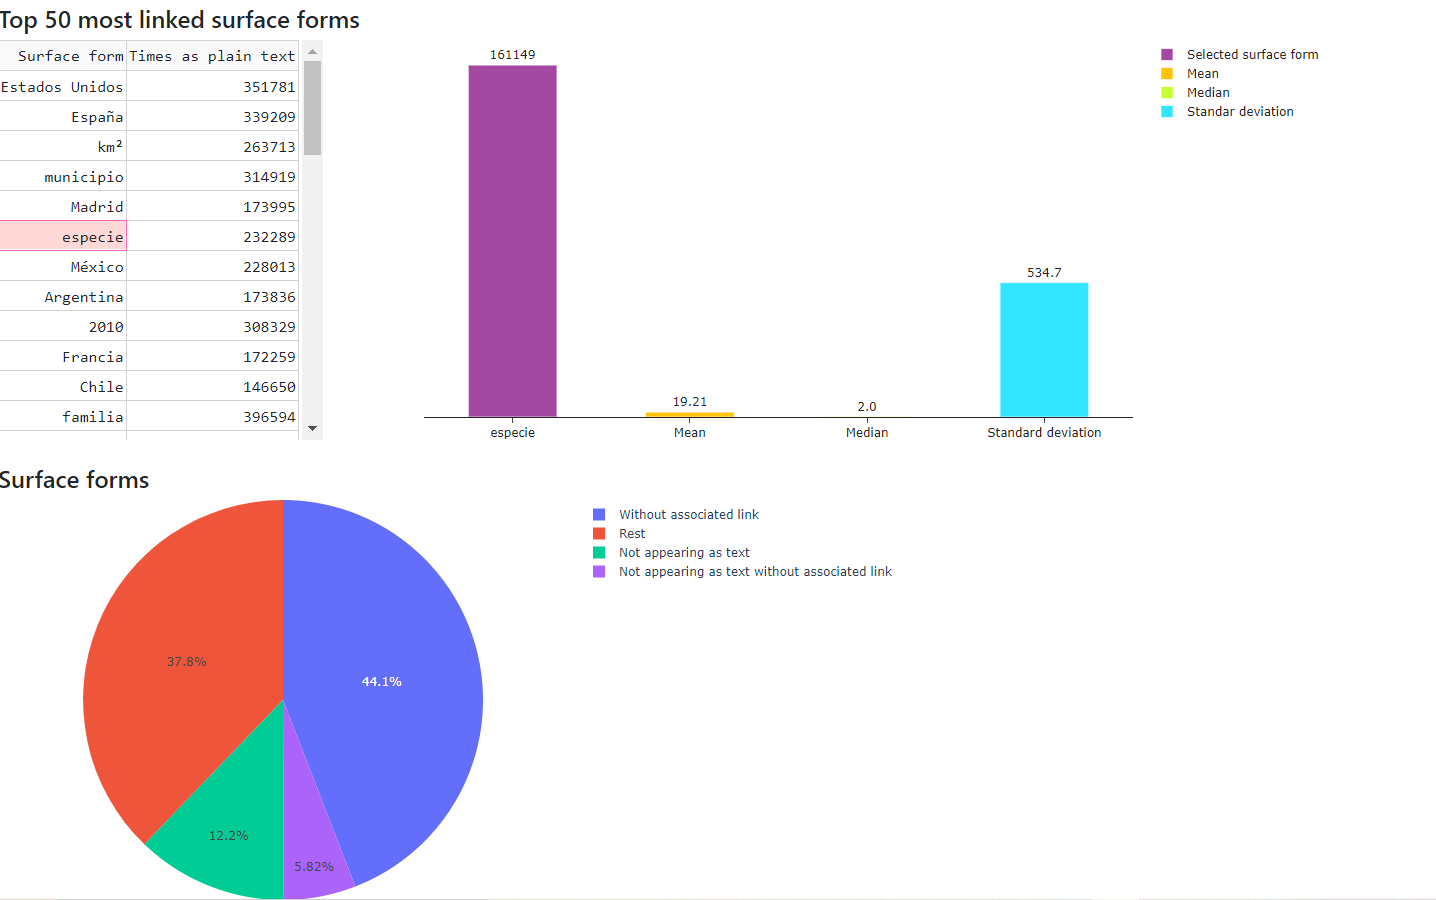
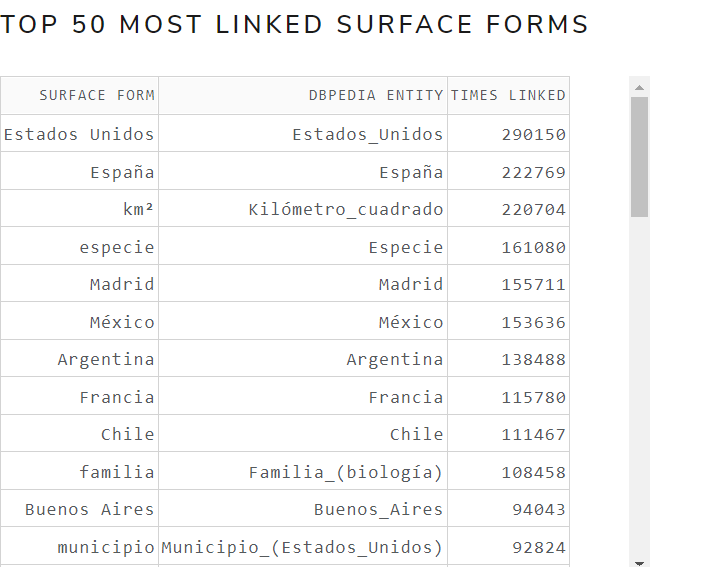
Figure 16 shows the calculated measures of central tendency and dispersion from sfAndTotalCounts file of May 2021 version for the English language .
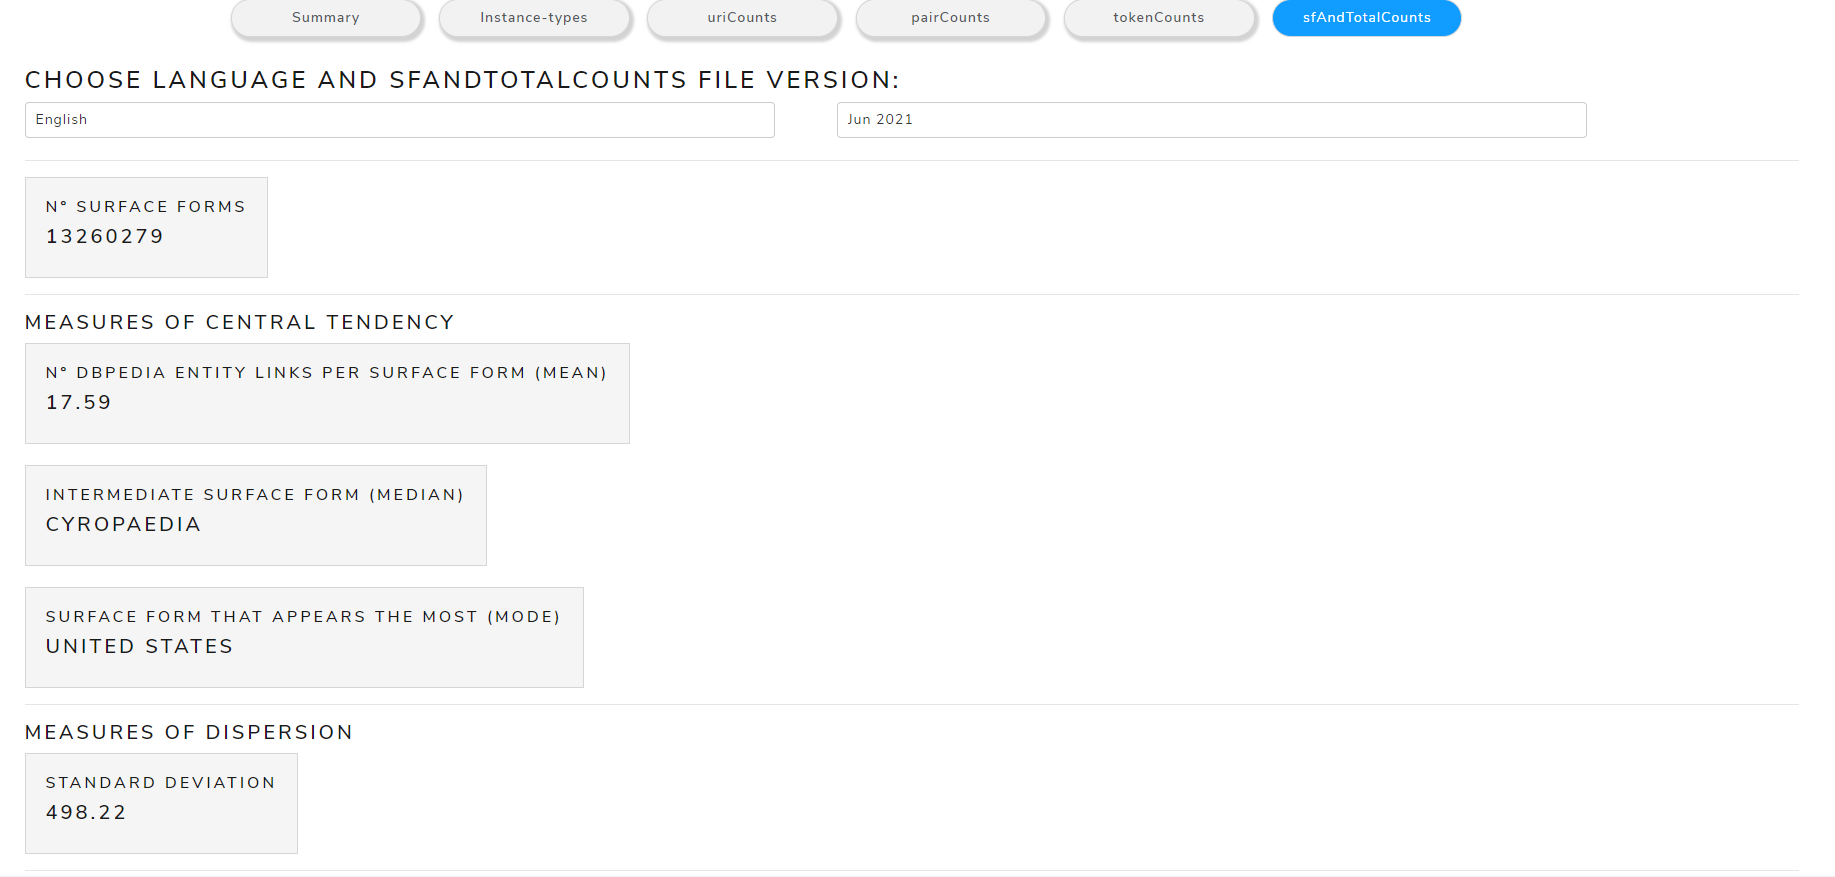 Figure 16. Calculated measures from sfAndTotalCounts file
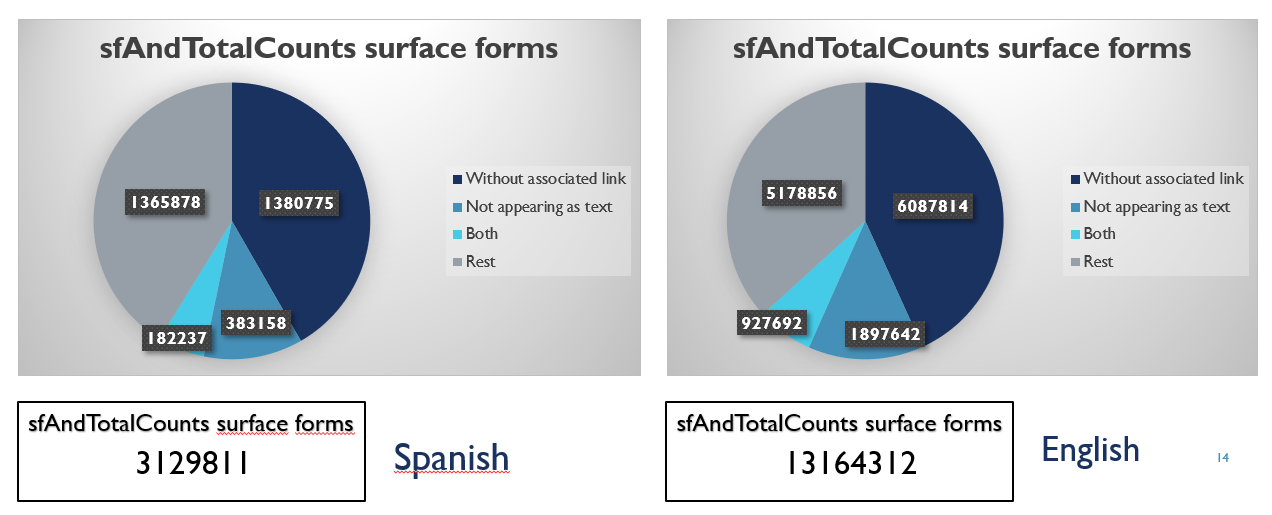
In addition, in Figure 17 can be seen the surface forms according to their state in the Wikipedia dump:
- Without associated link (-1 in second file column)
- Not appearing as text (0 in third file column)
- Not appearing as text without associated link (-1 in second file column and 0 in third file column)
- Rest (surface forms with associated link and appearing as text)
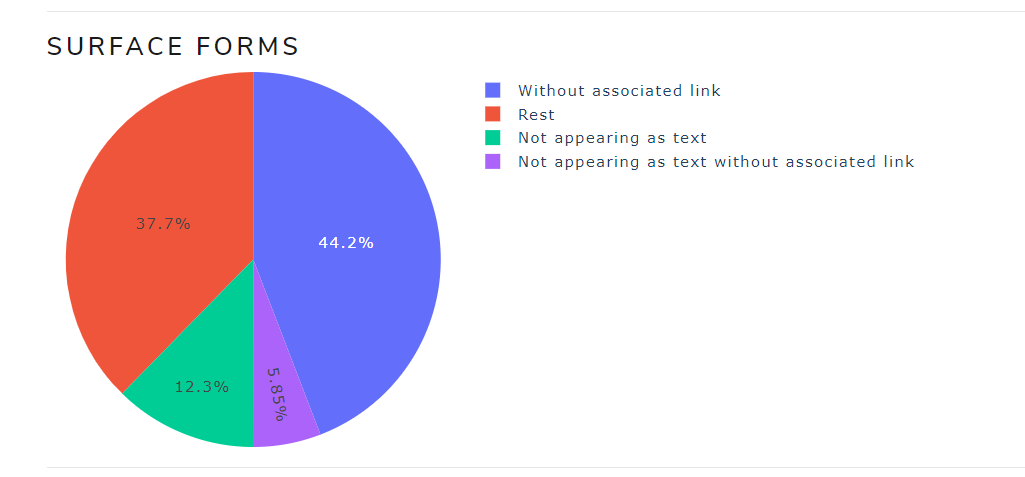 Figure 17. Surface forms state
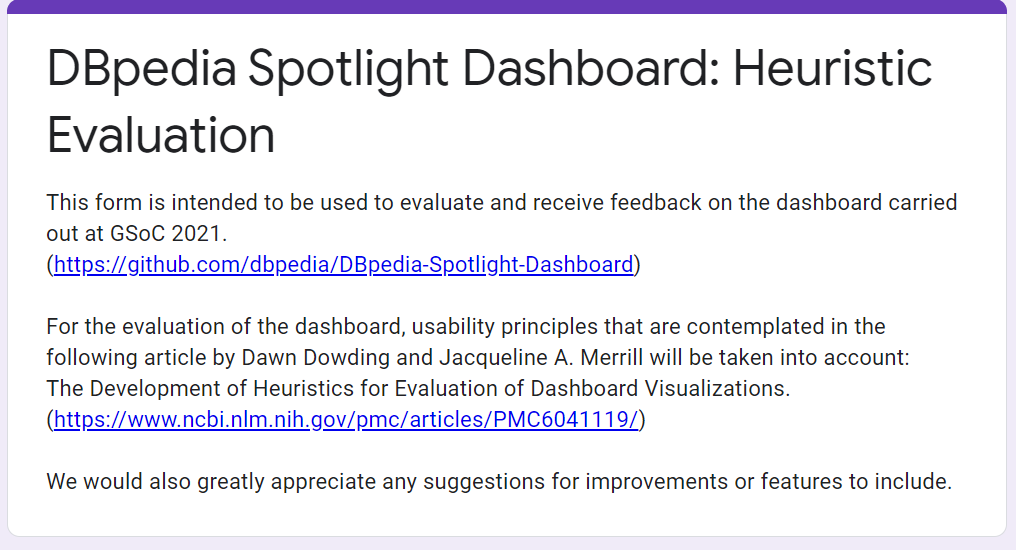
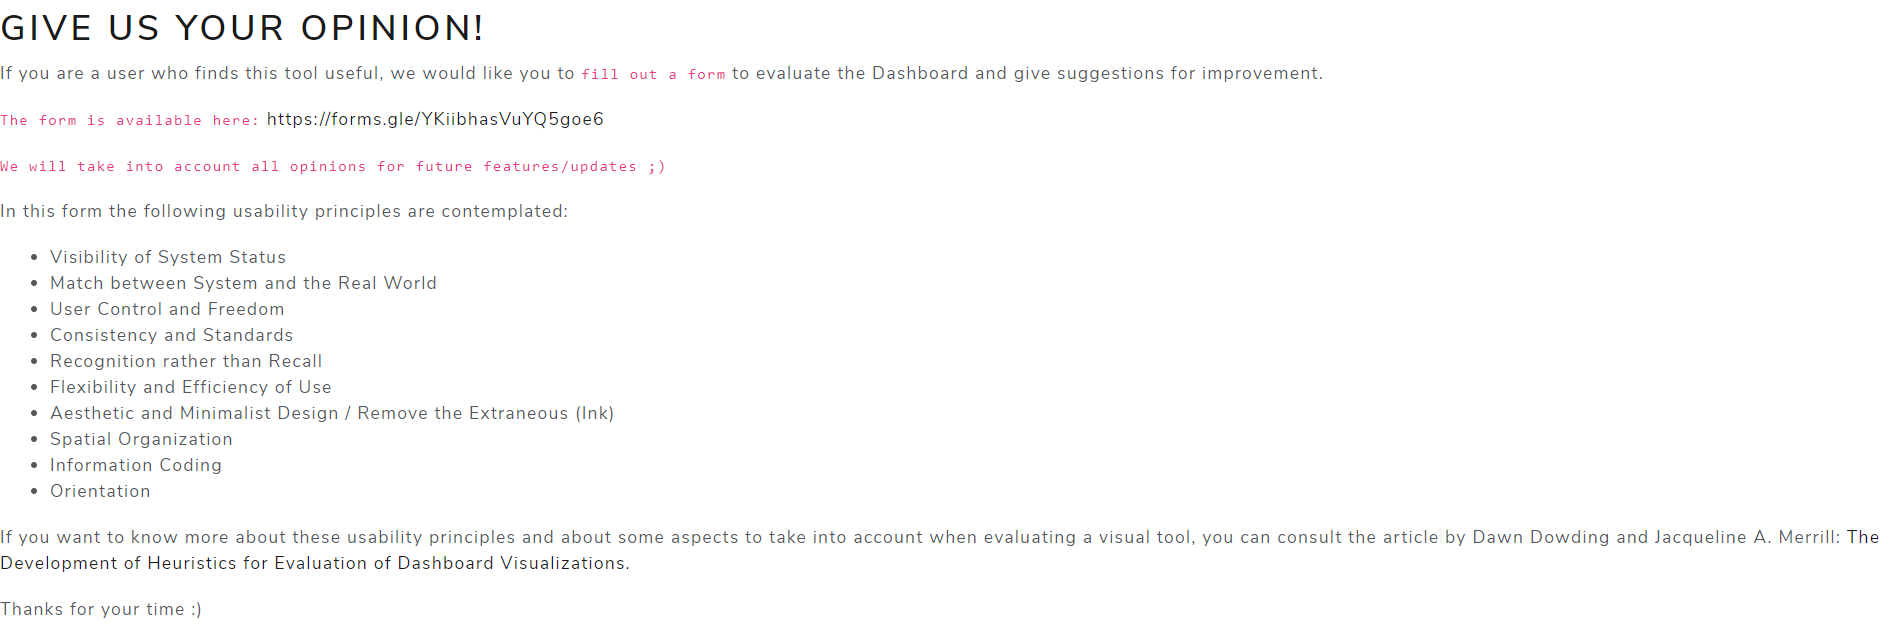
Feedback tab
Any questions or suggestions for improvement can be made by filling out the following form: https://forms.gle/YKiibhasVuYQ5goe6
Figure 18 shows the Feedback tab.
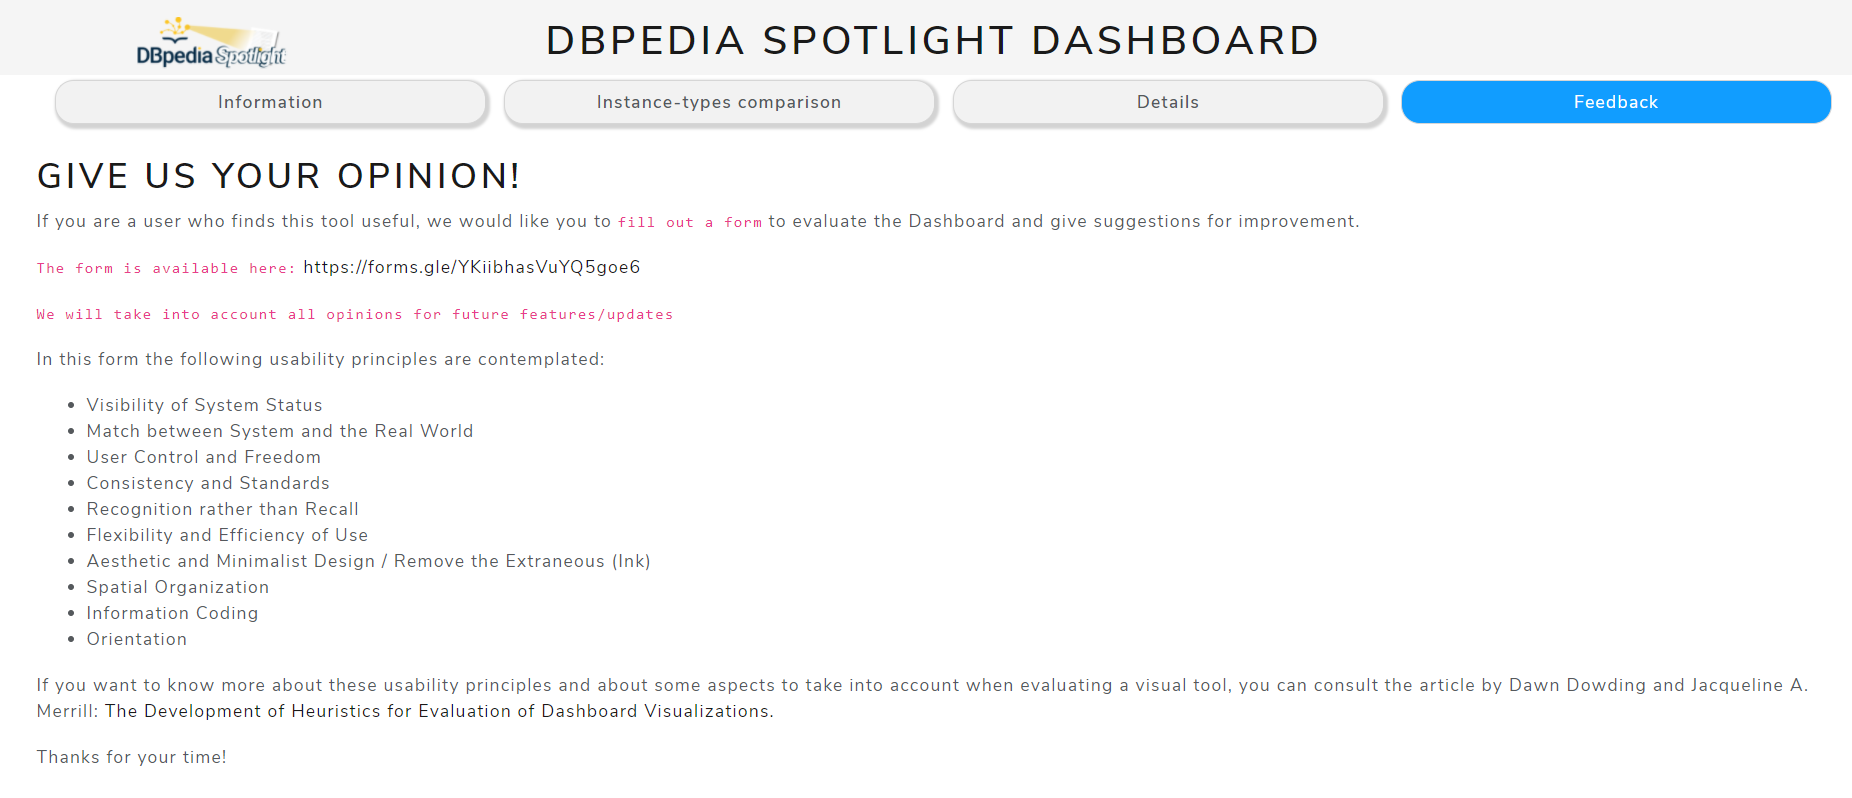 Figure 18. Feedback tab
Evaluation
The usability of the Dashboard has been evaluated according to the following usability principles:
- Visibility of System Status
- Match between System and the Real World
- User Control and Freedom
- Consistency and Standards
- Recognition rather than Recall
- Flexibility and Efficiency of Use
- Aesthetic and Minimalist Design / Remove the Extraneous (Ink)
- Spatial Organization
- Information Coding
- Orientation
People who carried out the evaluation are related to the area of Entity Linking or with a profile in Computer Science.
The results obtained are the following:
| Usability principle | Severity rating |
|---|---|
| Visibility of System Status | No Usability Problem - 66,7% | Cosmetic Problem Only - 33,3% |
| Match between System and the Real World | No Usability Problem - 83,3% | Minor Usability Problem - 16,7% |
| User Control and Freedom | No Usability Problem - 100% |
| Consistency and Standards | No Usability Problem - 100% |
| Recognition rather than Recall | No Usability Problem - 83,3% | Minor Usability Problem - 16,7% |
| Flexibility and Efficiency of Use | No Usability Problem - 83,3% | Cosmetic Problem Only - 16,7% |
| Aesthetic and Minimalist Design/Remove the Extraneous (Ink) | No Usability Problem - 83,3% | Cosmetic Problem Only - 16,7% |
| Spatial Organization | No Usability Problem - 83,3% | Cosmetic Problem Only - 16,7% |
| Information Coding | No Usability Problem - 100% |
| Orientation | No Usability Problem - 100% |
In addition, the dashboard as a whole was also evaluated:
| Nº people who gave a global rating | Mark (from 0 to 10) |
|---|---|
| 2 | 8 |
| 1 | 8.5 |
| 3 | 9 |
After observing the results of the evaluation, it has been determined that visual adjustments can be made to improve the rating of the following usability principles:
- Visibility of System Status
- Flexibility and Efficiency of Use
- Aesthetic and Minimalist Design / Remove the Extraneous (Ink)
- Spatial Organization
Also, corrections or functionalities can be added to the dashboard to solve minor usability problems in the following usability principles:
- Match between System and the Real World
- Recognition rather than Recall
Finally, it has been concluded that the dashboard can be improved in some aspects but is usable in general terms.
Used Tools
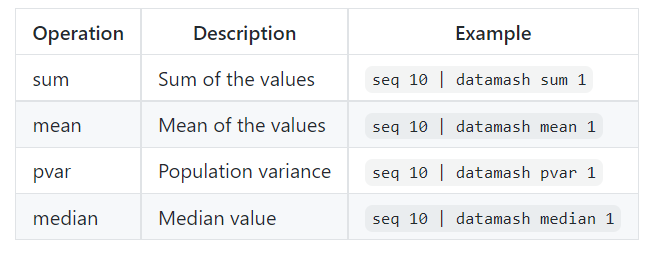
- GNU datamash for statistics calculation
GNU datamash is a command-line program which performs basic numeric, textual and statistical operations on input textual data files.
- Dash framework for building the web app
Dash is a productive Python framework for building web analytic applications.
Written on top of Flask, Plotly.js, and React.js, Dash is ideal for building data visualization apps with highly custom user interfaces in pure Python. It’s particularly suited for anyone who works with data in Python.
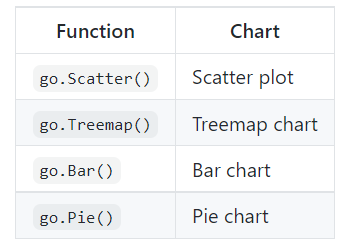
- Plotly Python graphing library for visualizations
Plotly’s Python graphing library makes interactive, publication-quality graphs. Examples of how to make line plots, scatter plots, area charts, bar charts, error bars, box plots, histograms, heatmaps, subplots, multiple-axes, polar charts, and bubble charts.
- Spyder IDE for development and integration
Spyder is a free and open source scientific environment written in Python, for Python, and designed by and for scientists, engineers and data analysts. It features a unique combination of the advanced editing, analysis, debugging, and profiling functionality of a comprehensive development tool with the data exploration, interactive execution, deep inspection, and beautiful visualization capabilities of a scientific package.
How to Run
In order to run the dashboard on yout local system, it is only necessary to:
- Clone the repository
- Go to the root folder and execute
main.shscript
The script will install all the necessary packages and modules
The dashboard web page will be running at: http://localhost:8050
Conclusions
Throughout this work:
- Raw data used by DBpedia Spotlight for the elaboration of models has been obtained
- These data have been submitted to the entity validation process
- Statistical measures have been calculated
- A dashboard has been built showing these measures using cards and charts.
Measures of central tendency, measures of dispersion and position measures have been calculated. Measures of central tendency are used to see where the data are grouped the most. Measures of dispersion are used to see the degree of variability of the data. Position measures divide the data into intervals of the same size.
After analyzing all these measures, the high degree of dispersion in the data has been observed, which means that the data is very far from the mean, that is, the data presents a high imbalance ratio. In addition, since entity types are highly unbalanced, much of the information in the dataset is covered by a small group of entities. Thus, after ordering the entities from highest to lowest, it was observed that the first quartile was covered by 1 or 2 types of entities, while the last quartile contained a large number of types of entities.
Future Work
These are some tasks that would be interesting to do in the future:
- Include the rest of the languages available in DBpedia-Spotlight in the
DetailsandInstance-types comparisontabs. - Define the statistical information as Linked Data
- Define an onotlogy for the representation of statistical information
Progress
[17/05/2021]: Proposal acceptance and community bonding period started.
[27/05/2021]: Meeting the mentors on Google Meet to introduce ourselves and talk about the project and interesting ideas:
- Load data from Wikistats (uriCounts, pairCounts, sfAndTotalCounts and tokenCounts) and DBpedia artifacts (instance-types, redirects and disambiguations) in dataframes using Pandas and RDFLib libraries.
- Create the desired visualizations using Matplotlib library.
- Use frameworks like Dash for building the dashboard.
- Compute the desired statistics over the dataframe using NumPy library.
- Publish the statistical data generated using Linked Open Vocabularies once the dashboard is built.
[10/06/2021]: Second meeting with the mentors, first advances in the project and new ideas:
- Get model raw data for Spanish and English -> Done
- Visualize DBpedia types for Spanish and English -> Done (problem: some hierarchy types are missing in the instance_types file)
- Validation of DBpedia links (entities) -> In progress (problem: IP address blocked for 1 day due to excessive requests) (new idea: get ALL DBpedia distinct resources doing SPARQL queries and store results in local file, then look for valid URLs comparing that generated file URLs and instance_types URLs using UNIX commands)
[14/06/2021]: Some progress:
- Validation of DBpedia links (entities) -> In progress (solving problem). I found out that all entities (both valid and invalid entities) are found on SPARQL endpoints, so the idea I came up with doesn’t work in this case. Regarding the first idea, even putting timeout between each request my IP address is still blocked (already 3 times in total)
- Review of the code generated so far -> Done
- Dashboard draft using Dash -> Done
[24/06/2021]: The problem of URLs validation has been resolved:
- URLs of the latest version of uriCounts file have been validated for Spanish language. For this, each URL of the file has been checked by means of the following SPARQL query (using a local SPARQL Endpoint to avoid DBpedia IP blocking):
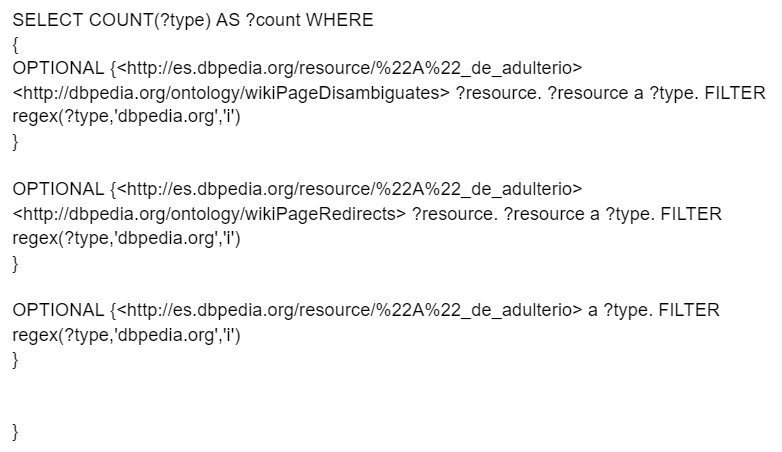
If the value returned by the query is 0, it means that this URL does not have any type, that is, it is a URL that does not exist and therefore is invalid.
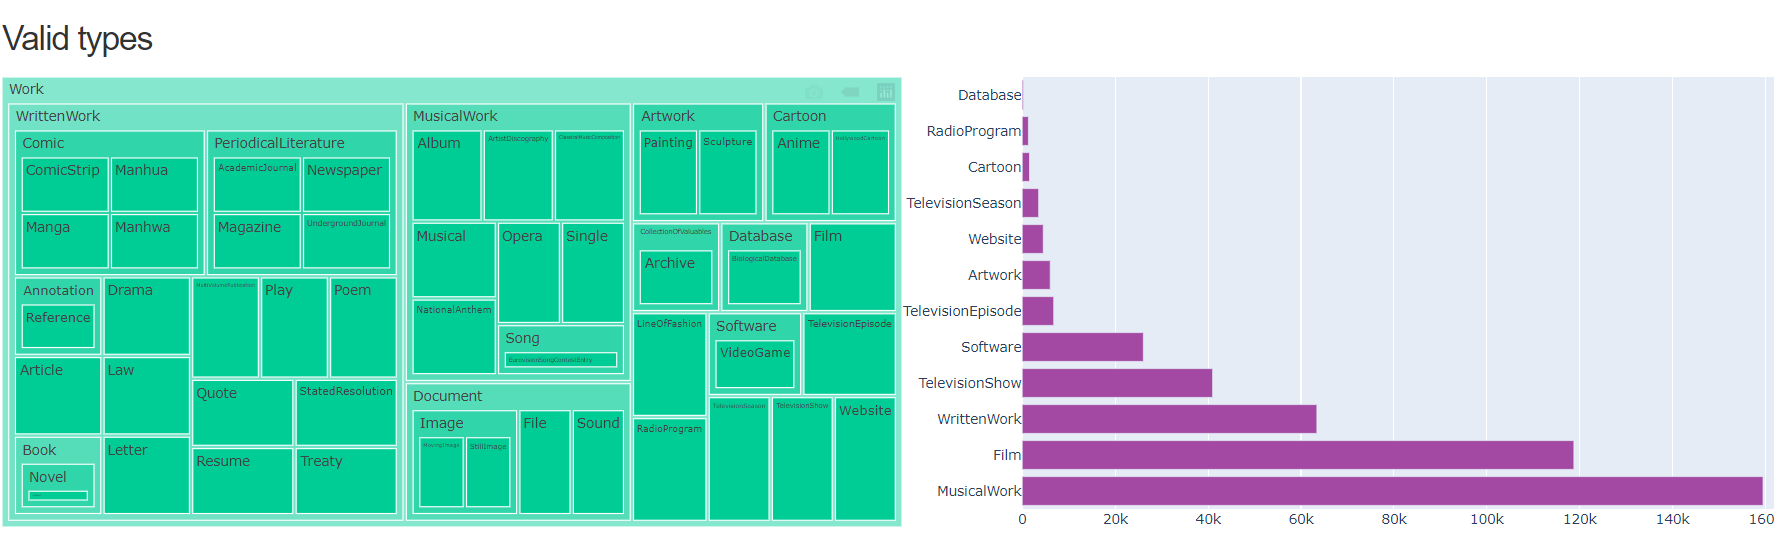
- Once valid and invalid URLs for Spanish were obtained, types of valid URLs have been obtained and can be viewed according to the DBpedia hierarchy:
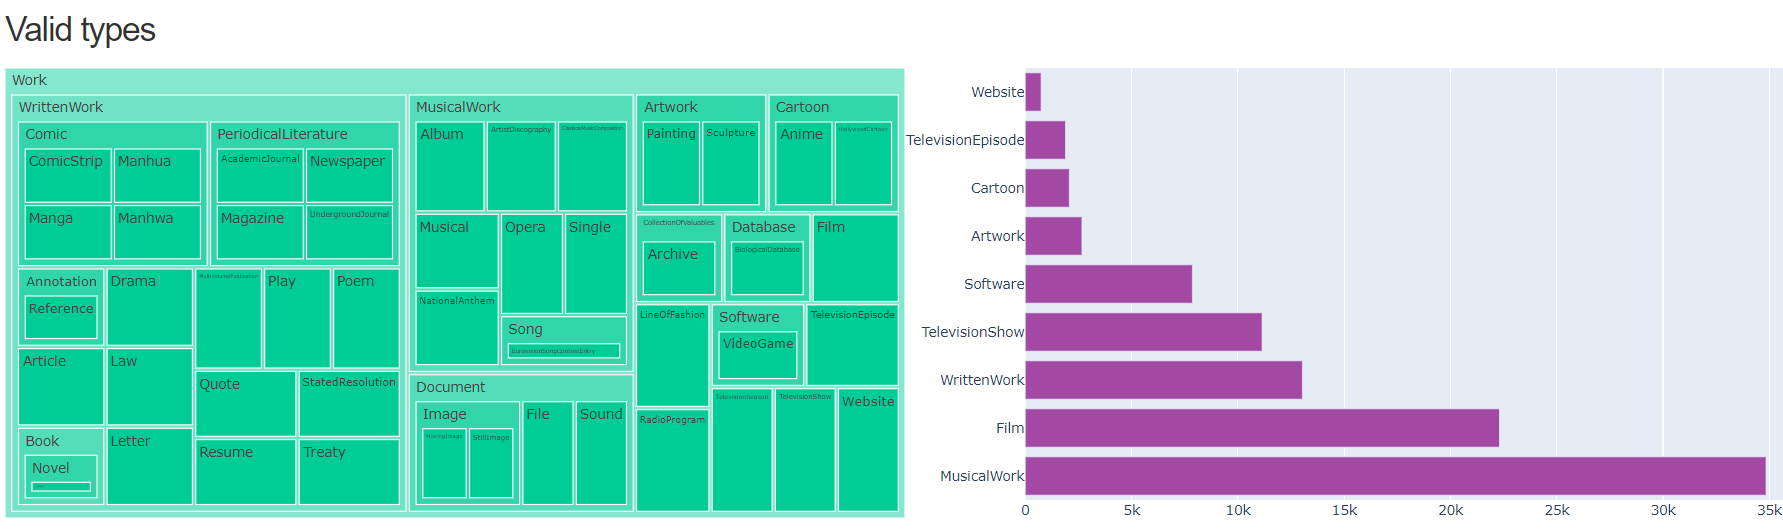
-
Precision and impact of Spanish URLs has also been calculated.
- URLs validation of the latest version of uriCounts file for English language -> In progress (executing)
- Types of valid English URLs -> In progress (executing)
- Precision and impact of English URLs -> In progress (executing)
[25/06/2021]: DBpedia entities used by Spotlight have been validated for both Spanish and English languages. Now is time to think of other interesting statistical measures to show on the dashboard:
- URLs validation of the latest version of uriCounts file for English language -> Done
- Types of valid English URLs -> Done
- Precision and impact of English URLs -> Done
- Think about other interesting statistical measures to show on the dashboard -> In progress
[01/07/2021]: Some statistical measures have been calculated from DBpedia datasets (redirects, disambiguations and instance-types) and Wikistats (uriCounts, pairCounts, tokenCounts, sfAndTotalCounts) for English and Spanish:
- Redirects and disambiguations:

- Instance-types:
- uriCounts:
- pairCounts:
- tokenCounts:
- sfAndTotalCounts:
Next tasks:
   1. Review all the statistics generated (especially those of the instance-types file) -> In progress
   2. Think about other statistics that may be interesting to have on the dashboard
   3. Think about how these statistics will be displayed on the dashboard
[02/07/2021]: Statistics have been revised and now they seem to be all good. Next thing to do is think about how to display them in the Dashboard.
[06/07/2021]: I have thought about how to display the statistics on the dashboard.
These are the statistics that are currently displayed:
- Firstly, the information of the Dbpedia Extraction Framework is displayed:
- Number of non-repeating entities (instance_types.nt)
- Non-repeating types (instance_types.tsv)
- Bar chart of instance-types.nt (instance_types.tsv)
- Then, the Spotlight information is displayed:
- Number of non-repeating entities with known types from Dbpedia (valid_urls)
- Number of non-repeating types (valid_types.tsv)
- Bar chart with known types (valid_types.tsv)
- Statistics on known types: median, mean, percentiles, quartiles, etc (valid_types.tsv)
This is how the dashboard is at the moment, waiting for feedback from the mentors to change what is necessary:
[08/07/2021]: Meeting with the mentors and new ideas for the Dashboard:
- Add a flowchart at the beginning where it can be seen how DBpedia Spotlight works
- Change some of the graphs so that the dispersion of the data can be better appreciated
[11/07/2021]: DBpedia Spotlight and Spotlight Dashboard flow charts have been made. Some Dashboard charts have also been changed, now the data looks better. Waiting for feedback from mentors:
- An additional tab has been added to the Dashboard called
Informationwhere the process of creating Spotlight models and the purpose and operation of the Spotlight Dashboard are explained, as well as flow charts to see both processes graphically.
- Some of the Dashboard graphics have been changed to better appreciate the dispersion of the data. In the case of Wikistats, since they are millions of data,
Slicershave been added so that the user can select different samples of the data. The information reflected in these graphs together with the tables (top 50) allow you to get an idea of what the data used by Spotlight is like.
[15/07/2021]: Meeting with the mentors in which the Dashboard has been reviewed and the following tasks to be carried out have been defined:
- Make the
Comparisontab, where the number of entities and the types found in the DBpediainstance-typesdataset will be compared for both Spanish and English for the following versions:2016.10.01 2020.10.01 2021.05.01 2021.06.01 - Think about the ontology to use to represent the calculated statistics as Linked Data. Also think if it is worth creating our own ontology to represent the information instead of using any of the existing ones or reusing terms from different ontologies.
[18/07/2021]:
Instance types,uriCounts,pairCounts,tokenCountsandsfAndTotalCountssub-tabs have been added within theSpanishandEnglishtabs to be able to view the information of interest in parts.
- The
Comparisontab has been made, where the different versions can be compared and the variation of entities and types between them can be appreciated.
[19/07/2021]:
- DBpedia types comparison between different versions of
instance-typesdataset has been added to theComparisontab.
Pending tasks:
- Ontology: think about statistics of interest to show and think about vocabularies to use or else, create an ontology.
- Wikistats: think about what data is interesting to show for the user or another way to show the data.
[20/07/2021]: Once the final version of the Dashboard is made (there are still pending tasks), the idea is to update it in the future with suggestions for improvement from the users:
- A form has been made to receive feedback from the Dashboard. This form evaluates the usability principles contained in the paper: The Development of Heuristics for Evaluation of Dashboard Visualizations.
- A
Feedbacktab has been added to the Dashboard. The direct link to the form appears in this tab, so that users can contribute their ideas for improvement after having examined the Dashboard.
[28/07/2021]:
- My mentors and I have considered eliminating the bar graphs from the Wikistats because they did not provide relevant information for the user and implied an excess of unnecessary information
- Instead, we have thought of displaying the relevant measurements in the form of cards:
- The corresponding statistical measures have also been added for the version of
October 10, 2016 - All statistical measurements have been reviewed and appear to be correct
- Added to the
Informationtab an explanation of the files from which the Dashboard statistics are obtained:
- Modified the Dashboard header and added the Spotlight logo as well as the appearance of the tabs, also added margins to the dashboard:

Tasks in progress:
- Add statistics of
2020.10.01and2021.06.01versions for Wikistats files - Add a
Summarytab to summarize the statistics in a table
[29/07/2021]: A Summary tab has been added to show users a summary of the statistics for English and Spanish.
[05/08/2021]: Meeting with mentors. Finally, the publication of the statistics as linked data is pending as a future task due to lack of time. It only remains to make some visual improvements to the Dashboard.
[11/08/2021]: Some visual changes have been made to the Dashboard:
- Changed the web page title and added the Spotlight icon
- Changed the order of the
Instance-typestab- The cards of each version have been put in different columns:
- The 2 bars of the left graph have been put separately:
- The cards of each version have been put in different columns:
- The Position measures graphs have been changed since the previous graphs were more confusing:
- Also the dashboard is already available to everyone at http://134.155.95.24:8050/
[15/08/2021]: Most of the visual changes suggested by the mentors have been implemented:
- The
medianmeasure has been eliminated from the Summary tab tables - Dashboard logo has been moved to the left
Englishand Spanish tabs have been removed and replaced by aDetailstab so as not to mix topics with languages
- Cards have been removed from the
Comparisontab and in their place a table with highlighted differences has been put
- Added space between buttons
- Horizontal lines have been added to separate views better
- The
Summarysub-tab has been assigned as default when clicking on theDetailstab - The
Detailstab dropdown has been synchronized so that you only have to select version 1 time (in theSummarytab preferably) - A summary of how statistics have been computed has been added to the
Informationtab - The width of the tables has been modified so that they can be seen well in all possible screens (Not checked yet)